
SOL Daily Analysis — A Fourteen-Session 98.62 Floor Broke on 2.15x: The 0.5 at 97.77 Is Gone and 98.62 Decides 104.18 or 88.04
SOL broke the 98.62 floor that held fourteen sessions, lost the 0.5 at 97.77 on 2.15x volume and stopped 0.99 over the 0.618. 98.62 decides 104.18 or 88.04.
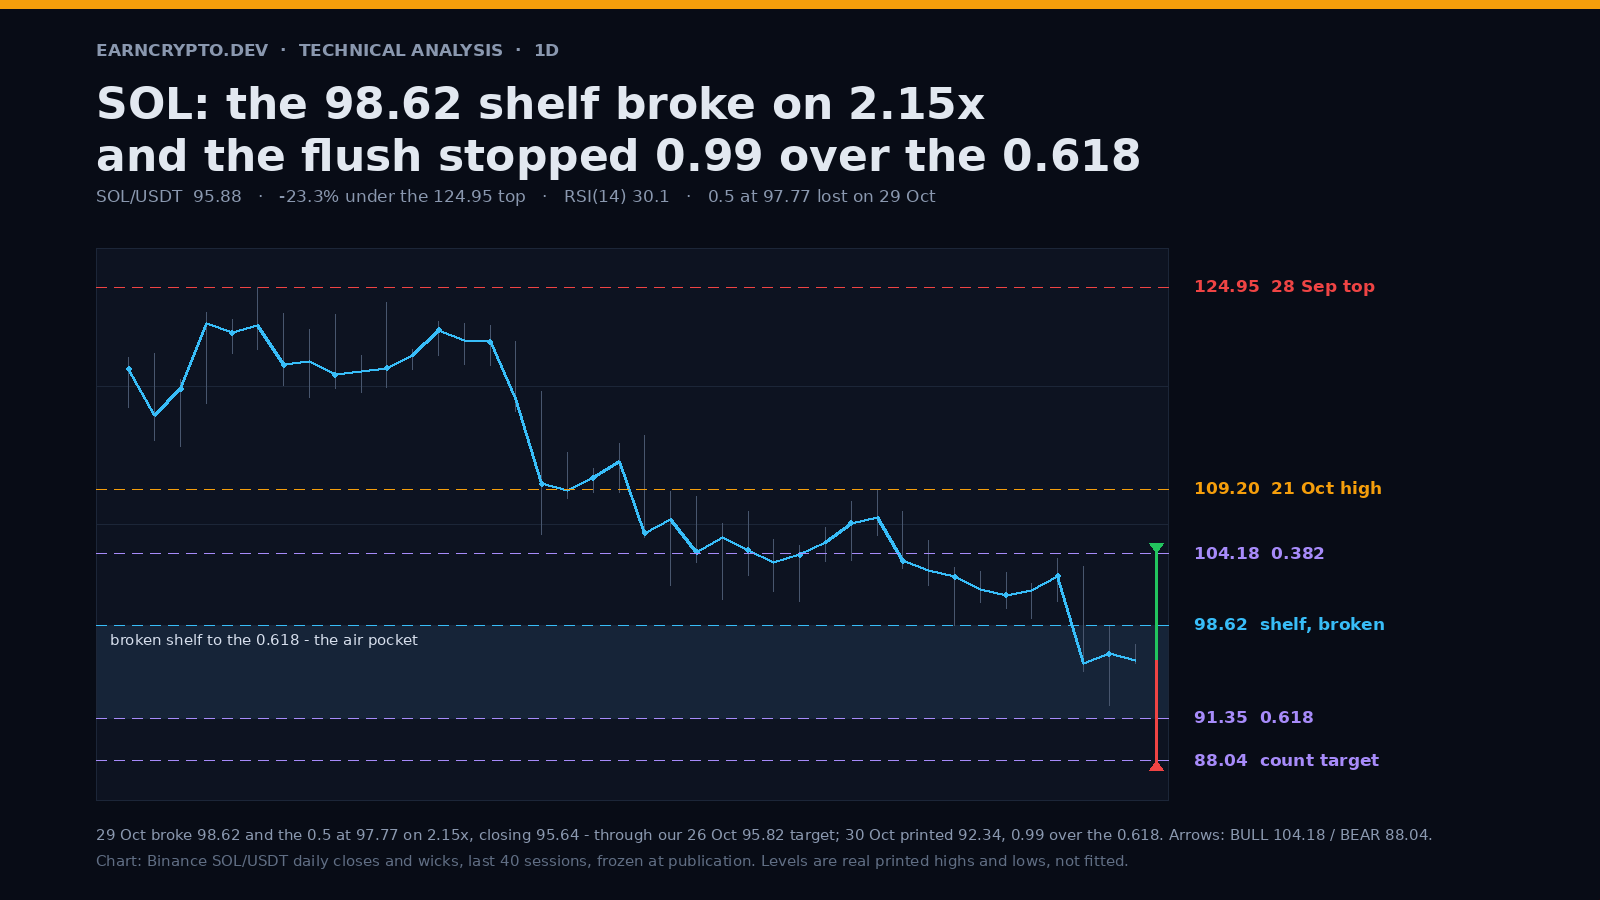
Fourteen sessions above 98.62, then three below 100
Solana opened at 96.38, tagged 97.09, printed 95.65 and settled at 95.86 — a 1.44 range on a Saturday session that is barely a fifth of a normal day's volume. That quiet close is the third in a row under 100, and the last time this pair closed below that number was 16 September.
The floor that broke is easy to date. From 15 October to 28 October, fourteen consecutive sessions printed lows of 100.62, 102.49, 101.25, 100.43, 103.54, 103.67, 105.63, 103.04, 101.73, 98.62, 100.37, 99.88, 99.16 and 100.46 — none of them under 98.62, the deepest print of the whole sequence. That is not a line drawn on a chart; that is fourteen sessions of buyers arriving before the number.
Advertisement
On 29 October the market went through it in one candle: a 102.44 open, a 103.18 high, a 95.00 low and a 95.64 close, on 3.72 million SOL — 2.15x the twenty-day average for that session. The 0.5 retracement of the whole advance sat at 97.77 and it went in the same move; the close was 2.12 under it. The 30 October session added 1.69x volume and a 92.34 low before closing at 96.38, 4.04 off that low.
The flush stopped 0.99 above the 0.618
The fibonacci grid that matters runs from the 70.58 low of 1 August to the 124.95 high of 28 September — a 54.37-point leg. Its 0.382 is at 104.18, its 0.5 at 97.77, and its 0.618 at 91.35. The 30 October low printed 92.34, which is 0.99 above the 0.618.
Advertisement
One percent of spot sounds like rounding until it is put next to the range: one 14-day average true range here is 3.92 points, 4.09% of spot, so the wick stopped a quarter of an average session above the retracement. A low that precise at a level that specific is usually where the first defence is, not where the move ends.
It is also the only level between here and the 88.04 count. Above it, the 0.5 at 97.77 and the 98.62 floor are two separate ceilings, 0.86 points apart, and both of them now have to be reclaimed before the break looks like a sweep.
Our 26 October note set 95.82 — the market printed 95.64
The previous note on this pair, published on 26 October under the title “Six Highs on One 1.5-Point Rail Over a Swept 98.62”, put the bear objective at 95.82 and the bull objective at 107.44. Three sessions later the 29 October close printed 95.64 — eighteen hundredths of a point through the bear number — and the market has spent the two sessions since grinding around it rather than extending away from it.
That is worth stating plainly rather than dressing up: the downside target was met and the market did not keep going. 107.44, on the other hand, is now 11.58 points and 12% away. A note whose bear case has been delivered is a note that has to be rebuilt from the next level down, which is exactly what this one does.
98.62 is the line, 88.04 is the count
The broken floor at 98.62 is the pivot. It sits 2.76 points, 2.9%, above spot, and a close back above it is the first thing that would make the two-session break look like a sweep rather than a repricing. Above 98.62 the 0.5 at 97.77 comes first, then the 0.382 at 104.18 — and that 0.382 is also the first place the lower-high sequence from 124.95 can be said to be over.
Underneath, the arithmetic is unhelpful for the bulls. The last lower high before the break was 109.20 on 21 October; 109.20 minus 98.62 is 10.58 points, and projected from the broken floor that is 88.04. The 30 October low at 92.34 has filled 59.4% of that distance. The count is not a fantasy number three ranges away — it is the next objective in a move that has already paid most of itself.
Between 92.34 and 88.04 the only thing on the chart is the 0.618 at 91.35, and it has already been tested once. The 50-day at 109.18 is 13.32 points overhead and spot is 7.2% under the 20-day at 102.79 — the moving averages are above the market, not below it, which is what a downtrend looks like on this timeframe.
The two paths from 95.86
Bull: reclaim 98.62 and hold it for two closes. The honest shape of that repair includes a failed poke first — a wick to 99.5, a rejection, a retest of 95.6 that holds, then a second attempt on volume. From 98.62 the 0.5 at 97.77 and the 0.382 at 104.18 are the objectives, and a close above 104.18 is what invalidates the bear case rather than a touch of it.
Bear: one close under 92.34 and 88.04 is the next print on the count, with 91.35 sitting between as the last defence. Expect the same chop that produced this week: a bounce to 95.9, a lower high at 97.7, a sweep of 92.34, then the slide — the 30 October session closed 4.04 points off its low, so a bounce before the break is the normal shape of this market, not the exception.
Fourteen sessions of buyers at 98.62 were erased by one candle at 2.15x volume, and the 0.5 went with it. The flush stopped a quarter of an average range above the 0.618; 88.04 is what the count says next.
SOL is quoted here from Binance SOL/USDT, with the same daily candles on TradingView and market-cap context on CoinGecko. Levels are real printed highs and lows; the scenarios are projections, not forecasts.
Written by
EarnCrypto.dev Editorial
The EarnCrypto.dev editorial team researches and reviews AI mining platforms, pools and earning tools — publishing only what passes our own checks.
Related reading
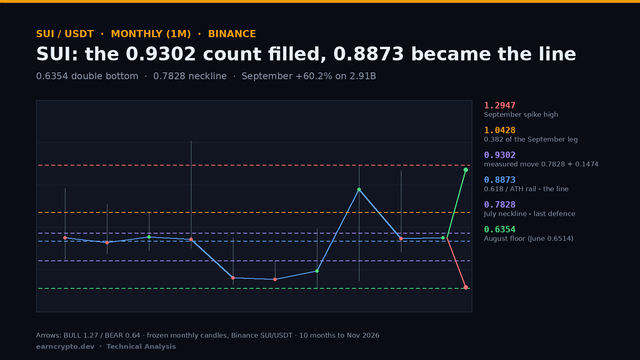
SUI Monthly Analysis — A 0.6354 Double Bottom Filled Its 0.9302 Count: The 0.8873 Retrace Decides 1.0428 or 0.7828
SUI filled the 0.9302 count of its 0.6354 double bottom at September's high and gave 22.8% back in October. The 0.8873 retrace now decides 1.0428 or 0.7828.
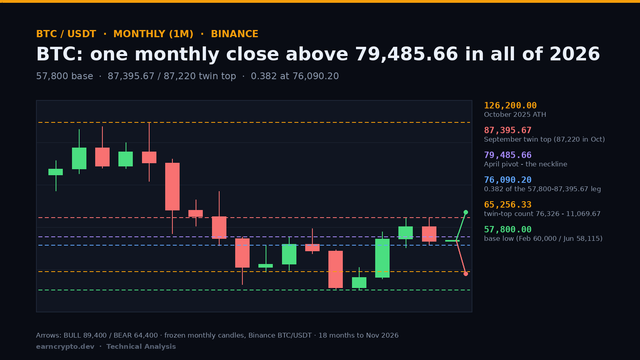
BTC Monthly Analysis — A Single 2026 Close Above 79,485.66 and an 87,395.67 Twin Top: 76,090 Decides 89,400 or 65,256
BTC closed October at 77,582, -7.2% under its open and back below the 79,485.66 pivot. The 76,090.20 retrace now decides whether 89,400 or 65,256 comes first.
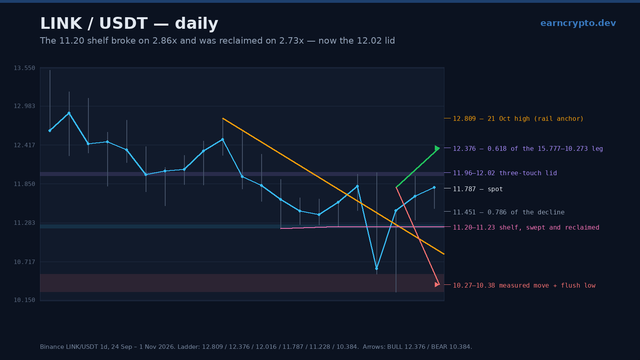
LINK Daily Analysis — The 11.20 Shelf Broke on 2.86x and Was Reclaimed on 2.73x: The 12.02 Lid Decides 12.38 or 10.38
Chainlink swept the 11.20 shelf on 2.86x volume, reversed the whole break on 2.73x and now fights a three-touch 11.96-12.02 lid. 12.02 decides 12.38 or 10.38.