
SOL Daily Analysis — The 120.00 Round Number Given Back: The 118.08 Retrace Decides 126.54 or 113.82
Solana gave back the 120.00 round number today, 5.0% under the 124.95 high it tagged on 27 September. The 118.08 retrace decides a 126.54 retest or 113.82.
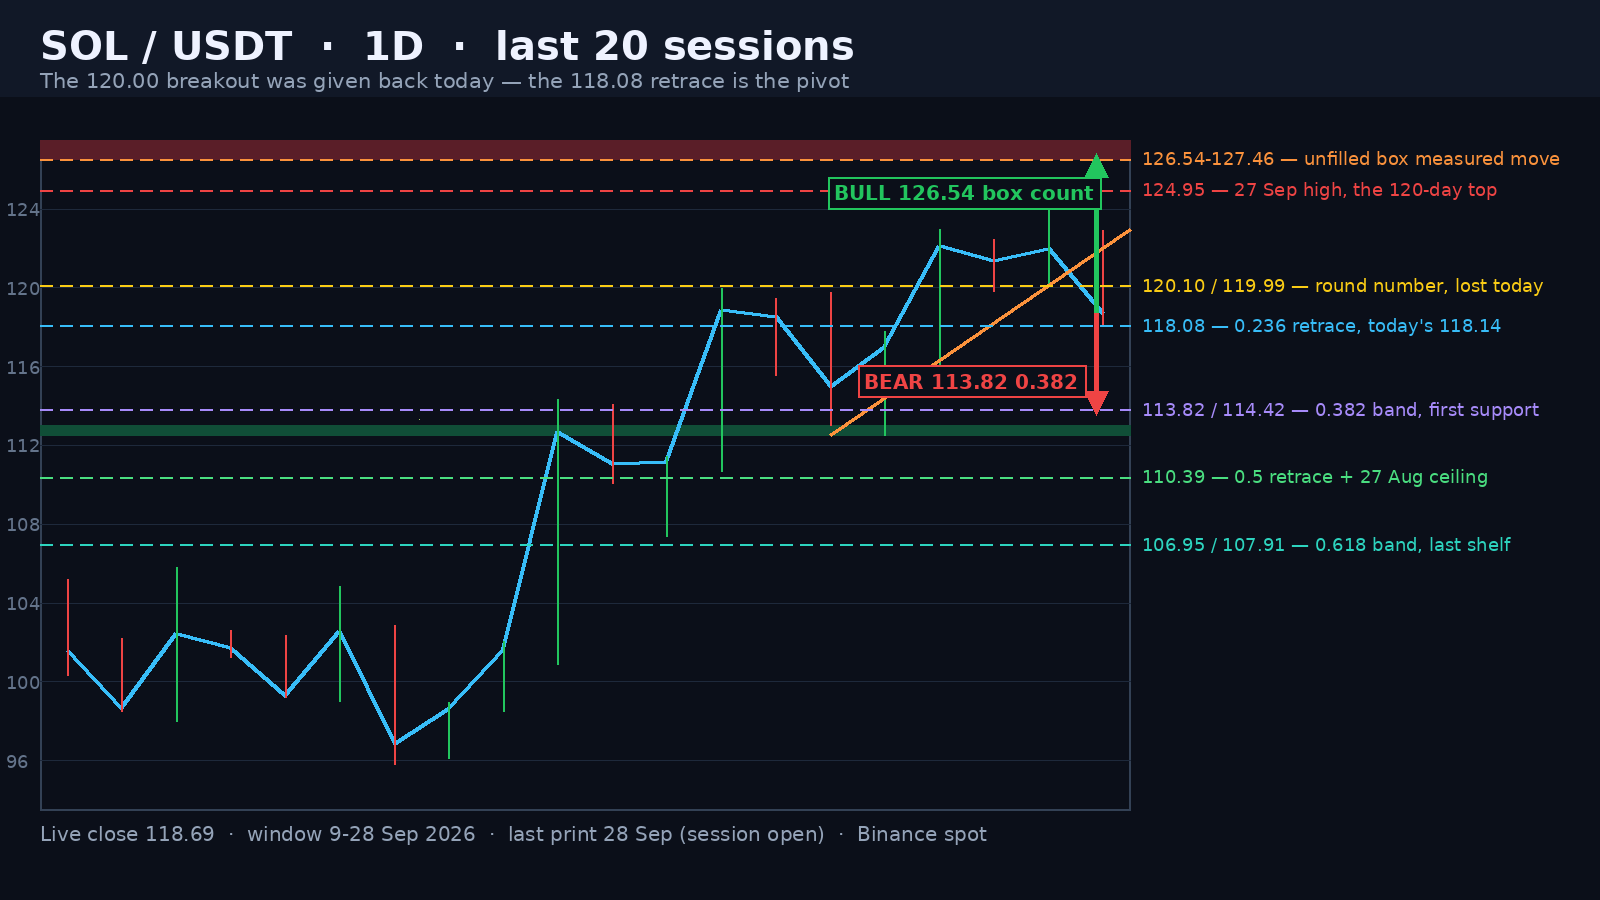
Solana is trading at 118.69 in the opening hours of the 28 September session, 5.01% under the 124.95 high of 27 September — the 120-day high — and 97.4% above the 6 June window low of 60.13. Today's range is 4.79 points, 4.04% of spot, on a 0.97x full-day volume pace against the 20-day average of 2,642,302 SOL. The low printed 118.14, and it lands six cents above the retracement that has been the fork in this structure since 21 September.
The Lid That Capped Three Sessions Broke on 25 September
The 21, 22 and 23 September highs printed 119.99, 119.48 and 119.77 — three separate attempts at the 120.00 round number from underneath. The 25 September session ended it: it opened 117.04, ran to 122.94 and closed 122.15 on 4,022,869 SOL, 1.52x the 20-day average, the heaviest candle since 23 September. The 26 and 27 September lows at 119.82 and 120.10 then held the broken level from above, and on 27 September the high went to 124.95 — the highest print in the 120-day window. That is how a breakout is supposed to look. Today it is being tested from the wrong side.
Advertisement
One Level, Two Ladders: 118.08
From the 15 September low of 95.82 to the 27 September high of 124.95 the leg is 29.13 points, and its 0.236 retracement is 118.08. Today's low of 118.14 is 6.5 cents above it. The wider ladder — 97.38 on 2 September to 124.95, 27.57 points — puts its 0.236 at 118.44 and its 0.382 at 114.42, so the whole 118.08-118.44 band is one measurement from two different legs. That is the first decision. The second is 113.82, the 0.382 of the shorter leg, which lands 82 cents over the 112.52-113.00 floor that held on 23 and 24 September.
The Rising-Lows Rail Broke Today
The lows since 24 September had been climbing: 112.52, then 115.86, then 119.82, then 120.10 — four prints on a rail that was rising more than 2.5 points a session. Today's low is more than four points under where that rail projected, so the rail is broken and the 120.10 level has flipped from floor to ceiling. The bull case no longer starts at the breakout; it starts at whether 118.14 sits on the 0.236 or through it.
Advertisement
What Each Side Needs
The bull case is that 124.95 is simply where the first leg stopped and that the 126.54-127.46 measured move is still open. The 112.52-119.99 box is 7.47 points deep, and projected up from its ceiling that is 127.46; the tighter 113.00-119.77 count gives 126.54 — the 124.95 high is 1.59 to 2.51 points short of the zone. To get there, the market needs a daily close back over 120.10, then 122.93, then a close above 124.95. Above it, 132.87 is the 1.272 extension of the whole 95.82-124.95 leg. The bull case dies on a daily close under 113.82: that is the 0.382, and it sits only 82 cents over the floor that held the last two corrections.
The bear case is that the breakout was given back inside one session on a level that three separate highs had already rejected, and that the 118.08 tag is the last support before a gap down to the 0.382. A daily close under 118.08 opens 114.42 and then 113.82, and losing the 112.52-113.00 floor targets the 0.5 at 110.39-111.17 — the exact level of the 27 August ceiling — and the 0.618 band at 106.95-107.91. The bear case dies on a daily close above 124.95, which would put the unfilled measured move back in play.
The Tape
RSI(14) is 63.0, so there is room in both directions and no exhaustion signal. The 20-day average is 109.61 and the 50-day is 99.51 — both far below spot, which means the medium-term structure is still an uptrend and this is a pullback inside it until the 112.52 floor fails. ATR(14) is 5.21 points, 4.39% of spot: this token moves 4% in a quiet session, so a 118.08 tag and a 120.10 reclaim can both happen inside two candles. Solana is flat on the week at −0.18% and up 12.39% on the month.
The breakout was real — the lid broke on 1.52x volume and the round number held for two sessions afterwards. What today did was take back the round number, not the structure. The 118.08 retracement is where that stops being a pullback and starts being a failure.
Watch the 28 September close. Back over 120.10 and the 126.54-127.46 measured move goes back on the board; under 118.08 and the market is looking at the 113.82 retracement, with the 112.52 floor behind it.
Binance SOL/USDT live chartSolana live price on CoinGeckoSOLUSDT chart on TradingViewWritten by
EarnCrypto.dev Editorial
The EarnCrypto.dev editorial team researches and reviews AI mining platforms, pools and earning tools — publishing only what passes our own checks.
Related reading

SOL Weekly Analysis — A 17-Week Doubling Topped Twice at 124.95 / 123.76: The 116.32 Neckline Decides 124.95 or 100.19
SOL doubled 107.8% in 17 weeks into a 124.95 / 123.76 two-touch top and paid its 108.29 count to 105.71. The 116.32 neckline decides 124.95 or 100.19.

AVAX Weekly Analysis — A 55.2% Thrust and Four 2x-Volume Weeks Under a 12.008 Two-Touch Top: The 10.866 Retrace Decides 14.25 or 8.387
AVAX ran a 55.2% week on 2.27x volume, then coiled four weeks under an 11.799 / 12.008 two-touch top. The 10.866 line decides 14.25 or the 8.387 count.

ETH Daily Analysis — A 2,392.96 Count 94% Filled and Five Rising Lows Back at the 0.382: The 2,635 Line Decides 2,777 or 2,406
ETH's 2,807/2,600 distribution left a 2,392.96 count that went 94% filled at 2,406.11. Five rising lows have retaken the 0.382 — 2,635 decides 2,777 or 2,406.