
LTC Monthly Analysis — A Six-Year Floor Held at 39.28: The $75.00 Gate Between 84.89 and 61.36
Litecoin held its six-year floor at 39.28 in June and closed September +38.5%, through a ten-month ceiling. The 75.00 gate now decides 84.89 or 61.36.
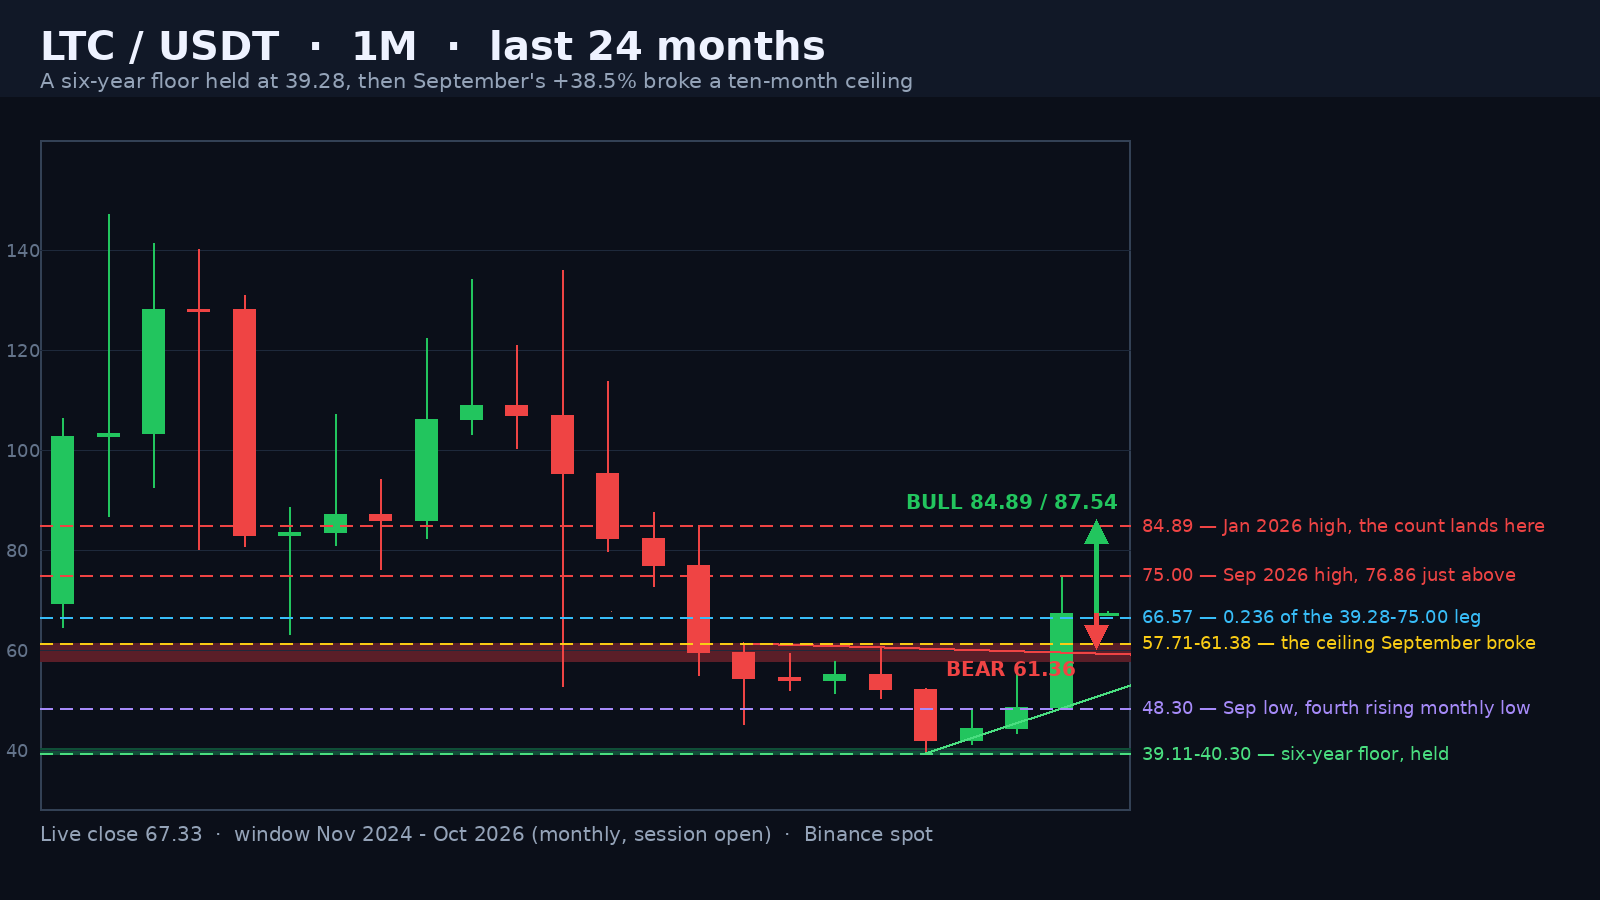
Litecoin is trading at 67.42 one day into the October monthly candle, 7.58 under the 75.00 high September printed and 72% above the 39.28 window low of June 2026. The month has traded a 0.87-point range so far — 1.29% of spot — which is what the last fourteen monthly ranges say is noise: the average high-to-low span over that stretch is 20.20 points, 30% of spot. Against that tape, September closed 18.70 points above its own open — +38.52% on the month — and a single candle reclaimed the four-month ceiling at 57.71-61.38 that had taken six months to lose. The levels that matter now are the ones September built and the ones it broke.
A Six-Year Floor, Seventeen Cents Deep
The low of the whole cycle printed 39.28 in June 2026. Look at what sits under it in Litecoin's Binance history: 37.14 in April 2020, 39.11 in June 2020, 40.28 in July 2020 and 40.30 in June 2022. June 2026 came within seventeen cents of the June 2020 low and held — the ten lowest monthly lows of the last eight years stop there. That is not a pattern drawn on a chart, it is a six-year accumulation shelf: 37.14-40.30 has now been bought four times across 2020, 2022 and 2026, and each of the last two touches — 40.30 in June 2022 and 39.28 in June 2026 — was answered by a monthly close above 41.9. The reaction to the latest low was a close of 41.93, then 44.31, then 48.55 — three months of nothing, which is what a floor looks like while it is being tested rather than celebrated.
Advertisement
Four Rising Monthly Lows
Since the June low, every single monthly low has printed higher: 39.28 in June, 41.14 in July, 43.39 in August and 48.30 in September. Four prints, four months, no exceptions — a rail climbing 3.01 points a month that projects into the low 50s by the end of the year. Draw it and the September candle is sitting on it: the 48.30 low is the rail's fourth touch, and the candle that touched it closed 18.70 points higher, in the upper third of its own 26.70-point range. Most monthly reversals show one higher low. Four consecutive ones — the first such run since October 2024 to January 2025 — is a bid that has been persistent rather than opportunistic.
September Broke a Ten-Month Ceiling — on Average Volume
The ceiling was real. February 2026 topped at 61.38 and closed 54.40; March topped at 59.26, April 57.71 and May 60.61 — four months of highs compressed into a 4.28-point band with the whole of the 2026 accumulation underneath it. September opened 48.55, ran through all four of those highs in one candle and closed 67.25, above the January 2026 low of 55.00 and the April 2025 low of 63.08 as well. What makes it imperfect is the volume: 15.47 million LTC traded, 0.94x the 20-month average of 16.38 million. A range break of that size on below-average volume is a break the market has not yet endorsed with size, which is the single strongest argument for a retest of the broken ceiling rather than a straight continuation.
Advertisement
The Fibonacci Map of the 39.28-75.00 Leg
Measure the recovery leg from the June low of 39.28 to the September high of 75.00 — 35.72 points — and the retracement ladder reads 66.57 at the 0.236, 61.36 at the 0.382, 57.14 at the 0.5, 52.93 at the 0.618 and 46.93 at the 0.786. Two of those five numbers are already famous in this window: 61.36 sits one cent under the February 2026 high of 61.38, so the 0.382 and the broken ceiling are the same line, and 52.93 sits sixty-four cents over the June 2026 high of 52.29. Measure only September's own candle — 48.30 to 75.00 — and the 0.5 lands at 61.65, inside the same band. Three independent measurements cluster at 61.36-61.65, which is why that band, and not the round 60, is the line that decides whether September's breakout is a reversal or a liquidity event.
What Each Side Needs
The bull case does not need a new high, it needs the 66.57 shelf to hold. That is the 0.236 of the leg and the first level the market has not yet tested on the way up. Holding it keeps the four-month structure intact, and a monthly close back over 75.00 opens 76.86, the January 2026 open, immediately — then the base count: the 39.28-61.38 range is 22.10 points, so a confirmed break projects 83.48, which lands under the January 2026 high of 84.89 and the December 2025 high of 87.54. Above those two, the 2025 shelf at 106.87 open, 113.71 high, 135.99 high is the next supply that exists at all. The bull case is cancelled by a monthly close under 61.36 — not a wick, a close, because the monthly ATR of 20.20 points guarantees wicks through any level this size.
The bear case is the mirror and it is not a small one. Lose 61.36 on a close and the recovery leg's 0.5 at 57.14 and 0.618 at 52.93 come immediately into play, with the rising-lows rail crossing the low 50s underneath them; a monthly close under 52.93 puts the August low of 43.39 and the four-touch floor at 39.28-40.30 back on the table. At a 20.20-point ATR the market can travel the whole 22.10-point distance between the two triggers in a single candle, so the close is the signal and the print is not. Note where the probability sits: price is above a broken ten-month ceiling with four rising lows underneath it, so the path of least resistance remains upward — but as a grind that should retest 57.71-61.38 before it commits, not a repeat of September.
Written by
EarnCrypto.dev Editorial
The EarnCrypto.dev editorial team researches and reviews AI mining platforms, pools and earning tools — publishing only what passes our own checks.
Related reading

SOL Weekly Analysis — A 17-Week Doubling Topped Twice at 124.95 / 123.76: The 116.32 Neckline Decides 124.95 or 100.19
SOL doubled 107.8% in 17 weeks into a 124.95 / 123.76 two-touch top and paid its 108.29 count to 105.71. The 116.32 neckline decides 124.95 or 100.19.

AVAX Weekly Analysis — A 55.2% Thrust and Four 2x-Volume Weeks Under a 12.008 Two-Touch Top: The 10.866 Retrace Decides 14.25 or 8.387
AVAX ran a 55.2% week on 2.27x volume, then coiled four weeks under an 11.799 / 12.008 two-touch top. The 10.866 line decides 14.25 or the 8.387 count.

ETH Daily Analysis — A 2,392.96 Count 94% Filled and Five Rising Lows Back at the 0.382: The 2,635 Line Decides 2,777 or 2,406
ETH's 2,807/2,600 distribution left a 2,392.96 count that went 94% filled at 2,406.11. Five rising lows have retaken the 0.382 — 2,635 decides 2,777 or 2,406.