
LTC Daily Analysis — Twin Peaks at 75.00 and a 12-Session Give-Back Capped by the 0.618: The 64.59 Rung Decides 66.58 or 61.76
LTC's 4.91x ignition candle topped at 74.86 and 75.00, then gave back 58% of the vertical. Three sessions have stalled under the 0.618 at 64.59: 66.58 or 61.76.
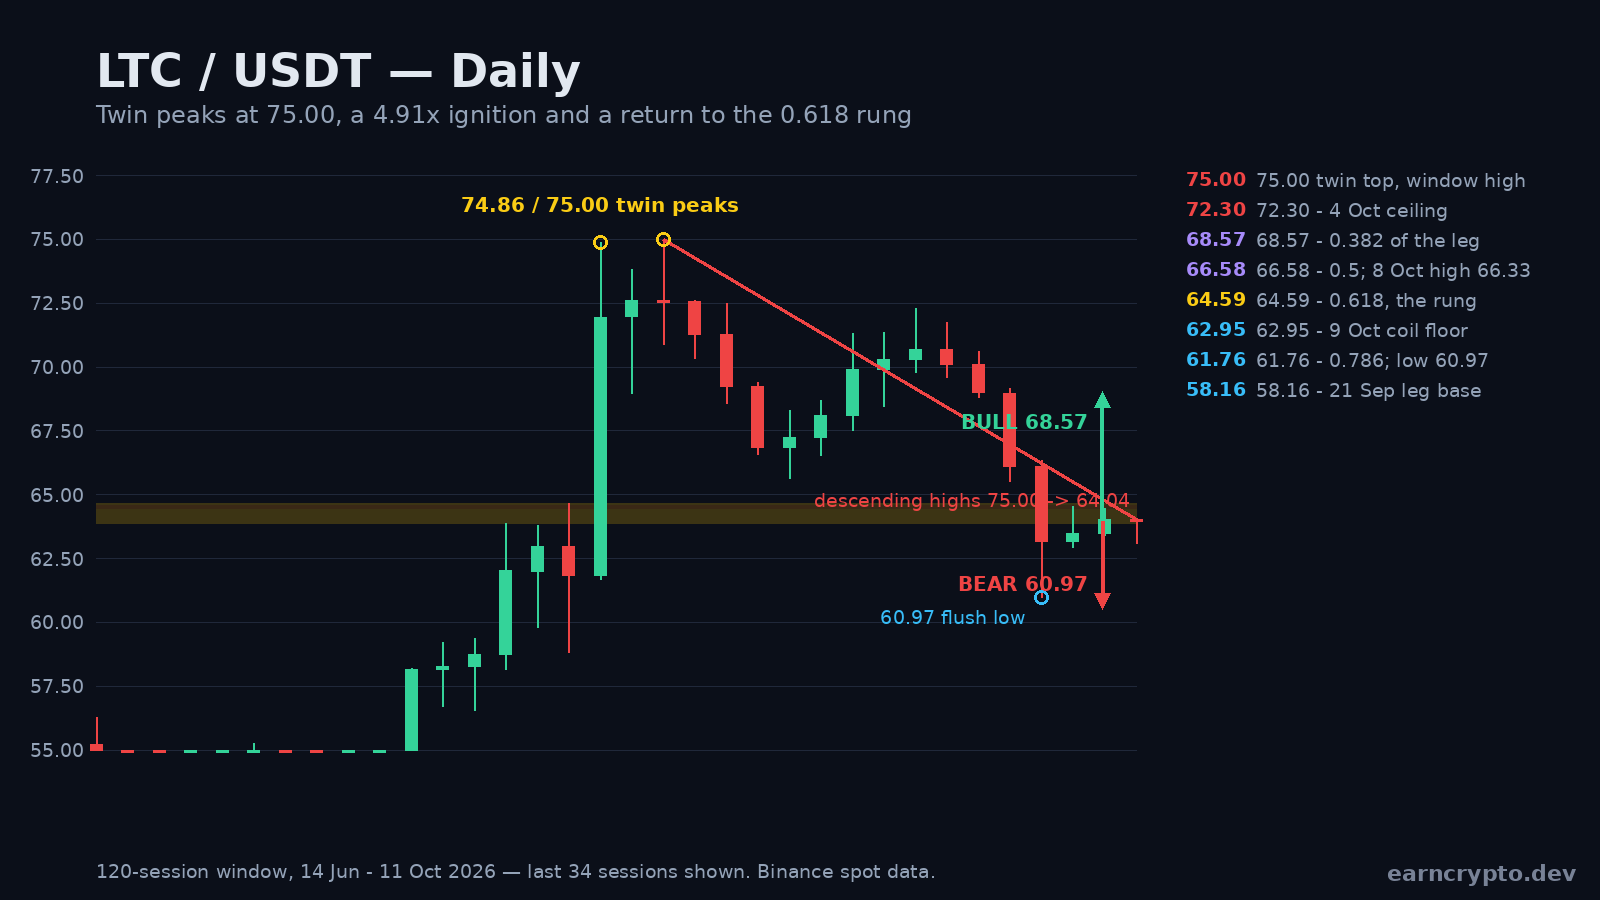
Litecoin's 24 September session is the one that set the whole board: an open at 61.85, a close at 71.95 and a high of 74.86, a 16.35% advance in a single daily candle on 2,158,258 LTC. That volume is 4.91 times the 20-day average of 439,724 that preceded it and the heaviest print of the entire 120-session window.
Two sessions later the market went back for that high and printed 75.00 on 606,090 LTC, barely a quarter of the ignition volume. Two peaks 0.14 apart, twelve sessions of decline since, and a market that is now trading back inside the shelf the candle was lit from.
Advertisement
The Give-Back Is 58% of the Wider Leg
LTC is quoted at 63.92 today, which is 14.7% under the 75.00 high. Measured against the wider 50.77 - 75.00 advance, the twins have retraced 57.9%: the 8 October flush printed 60.97, the lowest low since 23 September, when the market was still trading 58.80 on the way up.
That flush closed at 63.16, back above the 0.5 of the wider leg at 62.89, and it held 0.94 above the 0.618 at 60.03. A session that sweeps a low and finishes above the level is a liquidity print, not a breakdown, and nothing since has traded under 62.95.
Advertisement
Walking the Retracement Ladder
The 58.16 - 75.00 leg, from the 21 September low to the window high, gives the cleanest rungs: 0.236 at 71.03, 0.382 at 68.57, 0.5 at 66.58, 0.618 at 64.59 and 0.786 at 61.76.
The market has walked them in order. The 0.236 was lost on 6 October, the 0.382 on 7 October with a 4.17% session, and the 0.5 has capped everything since: the 8 October high printed 66.33, exactly 0.25 under it, and no session has closed back in that area. The 0.786 took the full flush, 0.79 through, and the close came back above it.
The Launch Shelf Is Now the Lid
The 0.618 at 64.59 lands inside a real shelf. 64.64 was the 23 September high, the last print before the ignition candle left, and the market has tagged that zone three times on the way back: 64.54 on 9 October, 64.44 on 10 October and 64.04 today. The launch pad has become the ceiling, and the 0.618 sits a tick inside it.
The last three sessions have been a 1.59-point coil between 62.95 and 64.54, with the highs fading by roughly a dime a session and the lows holding a point above the flush. Today's tape is 46,228 LTC, a 0.08x pace against the 20-day average of 574,968, which is what the end of a corrective leg looks like rather than the start of a new decline.
The Bear Case: 62.95, Then 60.03
The 6 October note published a 6.04-point count from the 68.96 neckline that projected 62.92. That count has been delivered and overspent: the 8 October flush went 1.95 through it before the reclaim, so the double top is no longer the live argument. What replaces it is the wider leg's arithmetic, the 0.5 at 62.89 and the 0.618 at 60.03, and a close under 62.95 would put both back in play with the 21 September base at 58.16 and the 0.786 of the wider leg at 55.96 underneath.
ATR(14) at 2.67 is 4.17% of spot, so a 4% daily range is ordinary here, and the 20-day mean at 67.77 is still 6.0% above the market.
The Bull Case: Reclaim 64.59
RSI(14) has closed four consecutive sessions under 29 (25.3 on 8 October, 23.9 on 9 October, 26.2 on 10 October and 28.2 today) while the price has stopped making lower lows. A close above the 0.618 at 64.59 clears the coil and puts 66.33, the 8 October high, and the 0.5 at 66.58 first, then the 0.382 at 68.57, the 7 October high at 69.17 and the 6 October ceiling at 70.62.
The invalidation is clean in both directions: under 62.95 the bounce is dead and 60.97 is exposed; over 64.64 the downtrend has nothing left to lean on until 66.33. Until one of those is closed through this is a 1.59-point coil on a 0.08x tape, which is a 55/45 lean to the bounce and no more than that.
The ignition candle was 4.91 times the average of the twenty sessions before it. Twelve sessions later the market has given back 58% of the move and stopped on the rung where the candle started, with a 0.618 lid at 64.59 overhead.
Charts for the same window: , and .
Written by
EarnCrypto.dev Editorial
The EarnCrypto.dev editorial team researches and reviews AI mining platforms, pools and earning tools — publishing only what passes our own checks.
Related reading

SOL Weekly Analysis — A 17-Week Doubling Topped Twice at 124.95 / 123.76: The 116.32 Neckline Decides 124.95 or 100.19
SOL doubled 107.8% in 17 weeks into a 124.95 / 123.76 two-touch top and paid its 108.29 count to 105.71. The 116.32 neckline decides 124.95 or 100.19.

AVAX Weekly Analysis — A 55.2% Thrust and Four 2x-Volume Weeks Under a 12.008 Two-Touch Top: The 10.866 Retrace Decides 14.25 or 8.387
AVAX ran a 55.2% week on 2.27x volume, then coiled four weeks under an 11.799 / 12.008 two-touch top. The 10.866 line decides 14.25 or the 8.387 count.

ETH Daily Analysis — A 2,392.96 Count 94% Filled and Five Rising Lows Back at the 0.382: The 2,635 Line Decides 2,777 or 2,406
ETH's 2,807/2,600 distribution left a 2,392.96 count that went 94% filled at 2,406.11. Five rising lows have retaken the 0.382 — 2,635 decides 2,777 or 2,406.