
LTC Daily Analysis — A $75.00 Double Top Two Sessions After a 4.91x Volume Candle: The $68.96 Neckline Decides 71.18 or 62.92
Litecoin tagged a 120-day high at 75.00 on 26 September after a 4.91x volume candle. Today's 67.01 undercut the 68.96 neckline that decides 71.18 or 62.92.
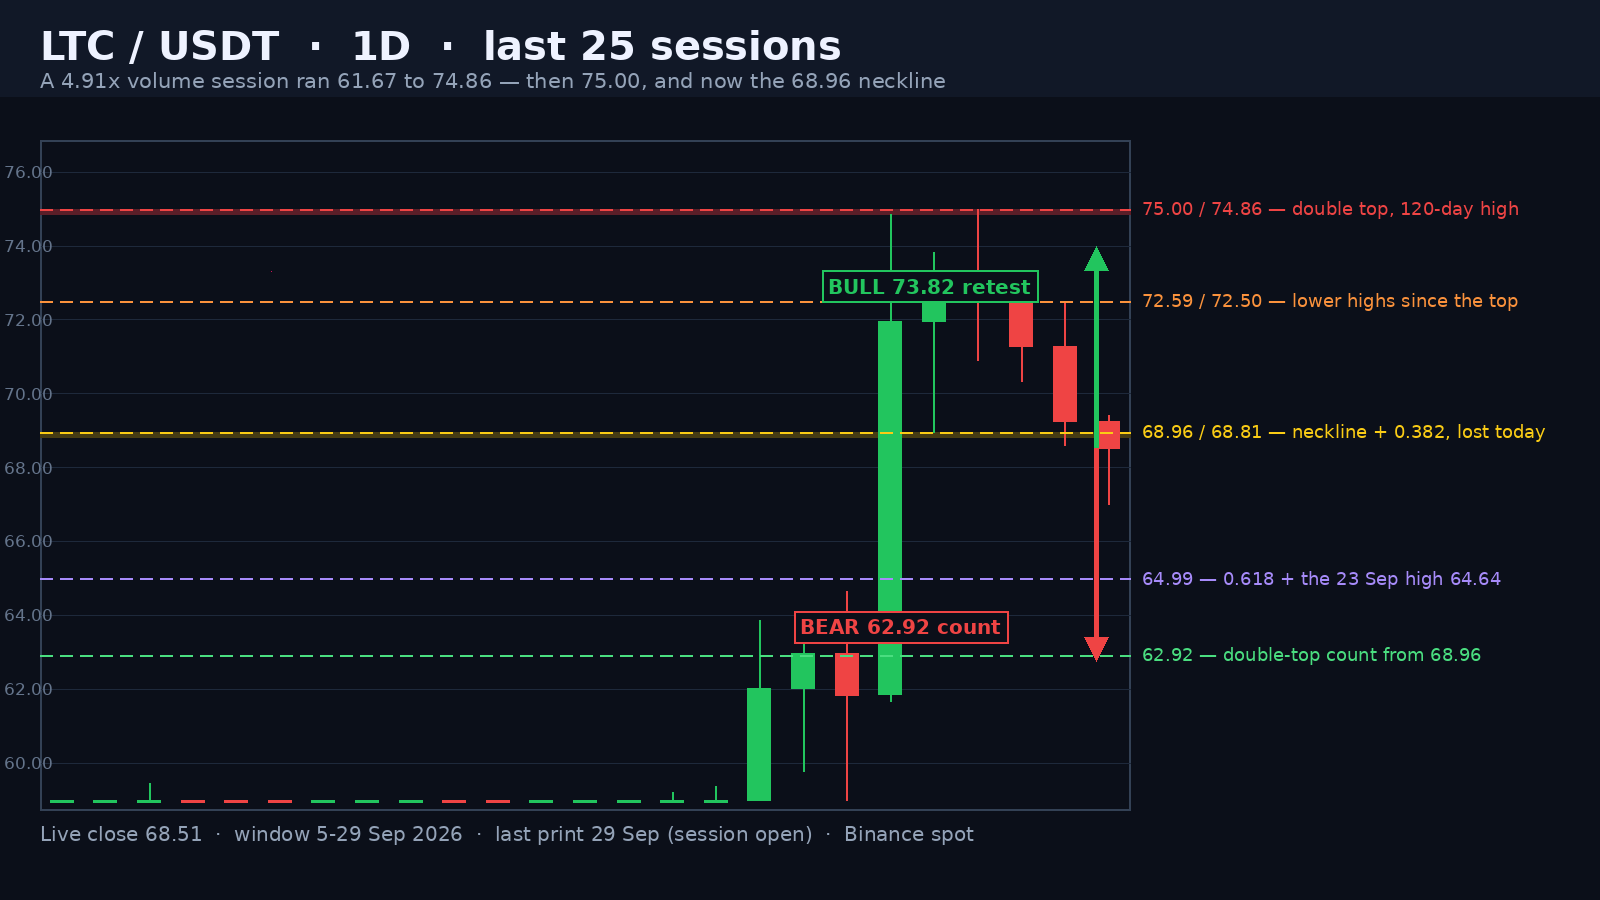
Litecoin is trading at 68.52 in the opening hours of the 29 September session, 8.64% under the 75.00 high it printed on 26 September — the 120-day top — and 74% above the 25 June window low of 39.28. Today's range is 2.39 points, 3.49% of spot, on a 0.23x full-day volume pace against the 20-day average of 552,818 LTC. The session has already traded both sides of the 68.96 neckline: the high ticked 0.44 over it before the low printed 67.01, 1.95 underneath, and the close sits 0.44 under it.
A 4.91x Volume Session Built the Whole Structure
The 24 September candle is the reason any of these levels exist. It opened 61.85, dipped to 61.67 and ran to 74.86 — a 13.19-point range — before closing 71.95, up 16.35% from the 61.84 close the session before. The volume behind it was 2,158,258 LTC, 4.91x the 439,724 average of the prior twenty sessions and the heaviest print anywhere in the four-month window. That was the 58.16-64.64 three-session flag breaking — the band the last Litecoin note called the gate — and it went in a single session, which is why there is no support shelf underneath the current price until the 0.5 retracement of the candle itself.
Advertisement
Two Tops Fourteen Cents Apart, and a Neckline at 68.96
No market needs a textbook double top to be topped, but this one is close to one. The 24 September high printed 74.86 and the 26 September high printed 75.00 — fourteen cents apart, 0.19% — with the 25 September low of 68.96 printed in between as the pivot, and that pivot is the neckline. Since the second top the highs have stepped down: 72.59 on 27 September, 72.50 on 28 September and the 69.40 print today. The volume faded with them — 4.91x, then 1.60x, 1.12x, 0.60x and 1.35x against each session's own 20-day average, with today's pace at 0.23x. That is what distribution under a high looks like, and it is why a wick under the neckline at 67.01 now weighs more than the 4.91x candle that built the structure.
Three Measurements Inside Sixty-Two Cents
The leg worth measuring is 58.80 on 23 September to 75.00 on 26 September — 16.20 points. Its 0.236 sits at 71.18, its 0.382 at 68.81, its 0.5 at 66.90, its 0.618 at 64.99 and its 0.786 at 62.27. Measure only the 24 September candle's own leg, 61.67 to 75.00, and the 0.5 lands at 68.34. That is the point of the level: the neckline at 68.96, the 0.382 at 68.81 and the shorter leg's 0.5 at 68.34 are three independent measurements inside sixty-two cents, and today's 67.01 low has traded through all three while the close has not followed it down. Note where the 0.618 sits — 64.99 is thirty-five cents above the 64.64 high of 23 September, the level the previous note used as its gate, which is why a deeper flush should find interest there rather than at a round number.
Advertisement
What Each Side Needs
The bull case needs the neckline, not the high. A daily close back over 68.96 after a wick to 67.01 would leave a failed breakdown under the structure, and the first confirmation above it is 71.18 — the 0.236, and the ceiling of the 27-28 September closes. Above that the road runs 72.50/72.59 (the two lower highs), then 73.82 (the 25 September high) and the twin 74.86/75.00 top. A daily close over 75.00 re-opens the measured move of the flag that broke on 24 September: 64.64 plus twice the 6.48-point band gives 77.60. The bull case stops working on a second consecutive close under the neckline — a single wick has already happened today, and it takes a daily close back over 68.96 to turn it into a failed breakdown rather than the start of the count.
The bear case starts from the same number on the other side. 75.00 minus the 68.96 pivot is 6.04 points, so the count lands at 62.92 — sixty-five cents above the 0.786 retracement at 62.27, and the level that turns a pullback into a completed double top. Between spot and that target sit 66.90 (the 0.5 of the whole leg) and 64.99 (the 0.618, backed by the 64.64 print). The bear case is cancelled by a daily close above 71.18; that would put 72.59 back in play and reclassify today's 67.01 as a liquidation wick inside an uptrend. With a 14-day ATR of 4.29 points — 6.26% of spot — a single session can cover the entire distance between the two triggers, so the close is the signal and the intraday print is not.
Written by
EarnCrypto.dev Editorial
The EarnCrypto.dev editorial team researches and reviews AI mining platforms, pools and earning tools — publishing only what passes our own checks.
Related reading

SOL Weekly Analysis — A 17-Week Doubling Topped Twice at 124.95 / 123.76: The 116.32 Neckline Decides 124.95 or 100.19
SOL doubled 107.8% in 17 weeks into a 124.95 / 123.76 two-touch top and paid its 108.29 count to 105.71. The 116.32 neckline decides 124.95 or 100.19.

AVAX Weekly Analysis — A 55.2% Thrust and Four 2x-Volume Weeks Under a 12.008 Two-Touch Top: The 10.866 Retrace Decides 14.25 or 8.387
AVAX ran a 55.2% week on 2.27x volume, then coiled four weeks under an 11.799 / 12.008 two-touch top. The 10.866 line decides 14.25 or the 8.387 count.

ETH Daily Analysis — A 2,392.96 Count 94% Filled and Five Rising Lows Back at the 0.382: The 2,635 Line Decides 2,777 or 2,406
ETH's 2,807/2,600 distribution left a 2,392.96 count that went 94% filled at 2,406.11. Five rising lows have retaken the 0.382 — 2,635 decides 2,777 or 2,406.