
LINK Daily Analysis — A 15.777 Blow-Off Gave Back the Whole 2.301 Vertical: The 13.477 Sweep Decides 16.15 or 12.85
LINK blew off to 15.777 on 3.03x volume, gave the whole 2.301 points back to 13.152 and closed above the 0.618. The 13.477 sweep decides 16.15 or 12.85.
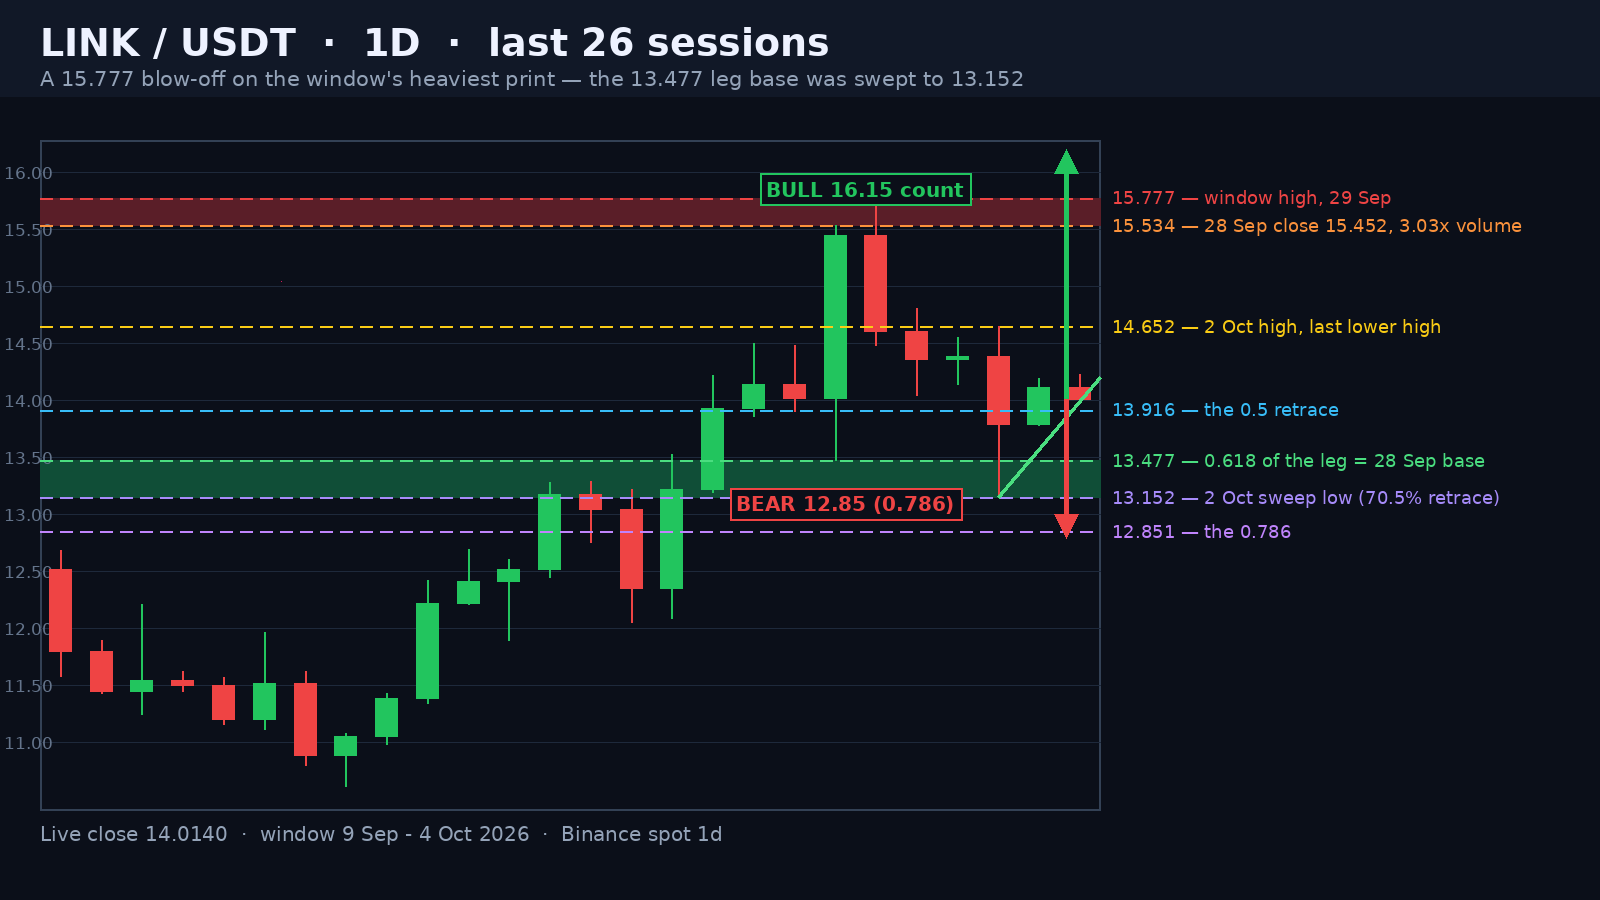
Chainlink is trading at 14.0080 in the opening hours of the 4 October session, 11.21% under the 15.777 high it printed on 29 September and 29.7% above the 10.80 low of 15 September that opened the run. Today's range is 0.2440 points, 1.74% of spot, on a 0.07x full-day volume pace against the 20-day average of 3.50 million LINK. The number that matters sits below the market, not above it: 13.4768 is the 0.618 retracement of the 12.055 - 15.777 leg and it is also the low of the 28 September candle itself, which the 2 October session pierced to 13.152 before closing 0.642 back above it.
A 3.03x Candle to 15.534 and a 15.777 Blow-Off
The 28 September session is where this run ended. It opened 14.024, ran to 15.534 and closed 15.452 — 10.18% in one session, on 8,631,655 LINK. That is 3.03x the 20-day average and the heaviest single print of the entire 120-day window, heavier than anything in the August advance. The market tried to extend the next day: the 29 September candle opened 15.451, printed the window high of 15.777 and closed 14.607, which is 1.170 points, or 7.42%, below its own high, on 5,495,212 (1.73x). Two sessions, the heaviest and the second-heaviest prints of the advance, and the second one handed 7.4% back. Nothing has traded above 15.534 since.
Advertisement
The Whole 2.301-Point Vertical Was Given Back
From 15.777 the market retraced everything the 28 September candle had produced. The 2 October session ran from 14.652 to 13.152 — a 1.50-point range, 10.87% of the close — and finished at 13.794. The low of 13.152 is 0.325 below the 28 September low of 13.476, and 13.476 is the base of the vertical, so the entire breakout candle was undone on an intraday basis. It is also a 70.5% retracement of the 12.055 - 15.777 leg: the 0.618 sits at 13.4768, eight ticks above that candle's own low, and the 2 October print went through it. What matters is what happened next. The close came back to 13.794, 0.642 above the low, so both the leg base and the 0.618 were reclaimed the same session. A level swept and recovered in one day is a shakeout, not a breakdown.
Two Rising Lows Off the Sweep
The follow-through has been orderly. The 3 October session closed 14.116, up 2.33%, and today's low of 13.991 is the second higher low off the sweep — the sequence runs 13.152, then 13.782, then 13.991. Volume, though, is not confirming: the 3 October session traded 1,496,138 LINK, 0.43x the 20-day average, and today is running at a 0.07x pace. The retracement ladder for the leg reads 14.899 at the 0.236, 14.355 at the 0.382, 13.916 at the 0.5, 13.4768 at the 0.618 and 12.851 at the 0.786, with the 12.055 low of 23 September as the origin. Spot at 14.0080 is holding just above the 0.5, and the 20-day average at 13.2569 sits 5.7% below the close while the 50-day at 12.1453 is 13% lower — the trend backdrop is still up.
Advertisement
Measured Move and What Each Side Needs
The bull case starts with the 0.382 at 14.355. A daily close above it puts the 2 October high of 14.652 — the last lower high — back in play, and then the 0.236 at 14.899. Above 14.652 the 13.152 - 14.652 box measures 1.50 points, projecting 16.15, which is the same shelf our 28 September weekly flagged as the January supply near 16.23. It is a long walk from here and it needs the 15.534 - 15.777 band cleared on volume, not on wicks: that band rejected two sessions in a row on 3.03x and 1.73x prints.
The bear case is simpler and nearer. A daily close under 13.782, the 3 October low that forms the rising rail, puts the sweep zone back on the table: 13.477 then 13.152. A close under 13.152 confirms the failure of the reclaim and the 0.786 at 12.8515 becomes the next rung, with the 12.055 leg origin underneath it. The 14-day ATR is 0.9215, or 6.57% of spot, so one average session can travel from 13.09 to 14.94 on its own — which is exactly why the daily close, not the wick, is the only signal here. RSI is 60.8, so momentum is firm without being stretched, and the path of least resistance leans mildly to a bounce toward 14.65 at roughly 55/45 while price holds above 13.782. A close back above 14.652 cancels the bear read entirely; a close under 13.477 cancels the bounce.
Written by
EarnCrypto.dev Editorial
The EarnCrypto.dev editorial team researches and reviews AI mining platforms, pools and earning tools — publishing only what passes our own checks.
Related reading

SOL Weekly Analysis — A 17-Week Doubling Topped Twice at 124.95 / 123.76: The 116.32 Neckline Decides 124.95 or 100.19
SOL doubled 107.8% in 17 weeks into a 124.95 / 123.76 two-touch top and paid its 108.29 count to 105.71. The 116.32 neckline decides 124.95 or 100.19.

AVAX Weekly Analysis — A 55.2% Thrust and Four 2x-Volume Weeks Under a 12.008 Two-Touch Top: The 10.866 Retrace Decides 14.25 or 8.387
AVAX ran a 55.2% week on 2.27x volume, then coiled four weeks under an 11.799 / 12.008 two-touch top. The 10.866 line decides 14.25 or the 8.387 count.

ETH Daily Analysis — A 2,392.96 Count 94% Filled and Five Rising Lows Back at the 0.382: The 2,635 Line Decides 2,777 or 2,406
ETH's 2,807/2,600 distribution left a 2,392.96 count that went 94% filled at 2,406.11. Five rising lows have retaken the 0.382 — 2,635 decides 2,777 or 2,406.