
ETH Weekly Analysis — A 2,666 Two-Touch Lid Flipped to Support: The 2,635.69 Retest Decides 2,949 or 2,310
Ether weekly: a 31.3% August week off 1,505.68, a 2,666 two-touch lid broken into a 2,807.34 high, and a retest held twice. 2,635.69 decides 2,949 or 2,310.
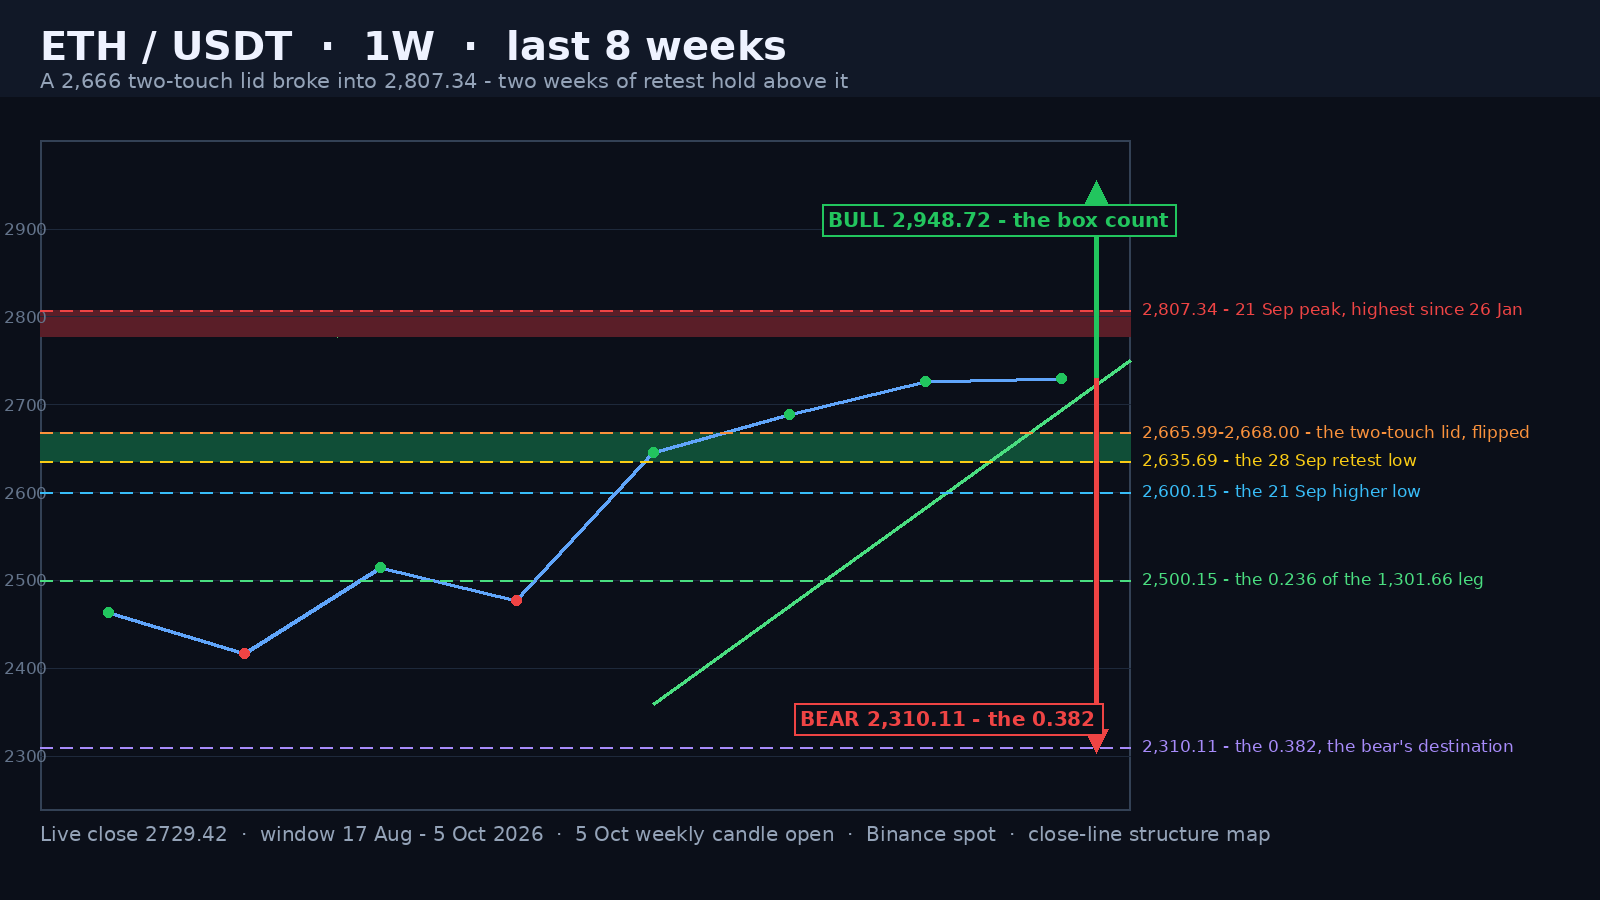
Ether closed the week of 28 September at 2,726.94 and is trading 2730.31 early in the 5 October week — 44.9% under the 4,956.78 all-time high of August 2025, 81.3% above the 1,505.68 cycle low the 1 June week printed, and 2.74% under the 2,807.34 high of 21 September. The last eight weekly candles are the cleanest sequence of the year: a 31.3% reversal week, a two-touch lid at 2,665.99 - 2,668.00, a breakout to a 2,807.34 print that is the highest weekly high since 26 January, and now a retest that has held for two consecutive weeks. The line that decides is 2,635.69, the 28 September low — the only print that has tested the underside of that lid.
A 31.3% Reversal Week Off 1,505.68
The week of 17 August is where the turn starts. It opened 1,876.01, ran to 2,546.78 and closed 2,463.41 — 31.3% in one week, on 3.37 million ETH, 1.78x the 20-week average of 1.90 million and the heaviest week since the 1 June capitulation that printed 4.44 million. In one week that single candle undid four months of decline, and it did it from 1,505.68, the lowest weekly print of the whole 120-week window apart from the April 2025 flush to 1,385.05. The 20-week mean sits at 2,122.51, 28.6% under spot, and the market has not traded back to it since: that gap is the measure of how far this rally has travelled without a single weekly close below.
Advertisement
A 2,666 Two-Touch Lid Over Five Weeks, Then the Break
Between the reversal week and the breakout, the market spent five weeks coiling under one level. The week of 7 September printed 2,665.99 and the week of 14 September printed 2,668.00 — two highs two points apart, on 1.14x and 1.19x volume, both above the 20-week average. Nothing closed above it: the closes were 2,477.10 and 2,645.21, the second one 0.85% inside the lid and the first 7.1% inside. A inside. A ceiling tagged twice, two points apart, with rising weekly lows underneath it, is an ascending structure, and the week of 21 September resolved it: it opened 2,645.21, broke the lid outright and printed 2,807.34, closing 2,688.65 — still 4.2% under its own high, which is the caution in the print.
Two Weeks of Retest Above the Broken Lid
The week after the breakout did the honest thing and sold. It opened 2,688.65, slid to 2,635.69 — 1.21% under the lid — and closed 2,726.94, back above it, on 1,743,816 ETH (0.92x the average). Volume falling into a retest is what a healthy pullback looks like; volume rising into one is what distribution looks like. This week has so far printed a low of 2,694.88, which is 1.01% above the lid, and is holding 2730.31. Two weekly lows above the broken ceiling — 2,635.69 and 2,694.88 — is what a retest that works looks like. Measured from the 2,807.34 high, the deepest weekly retrace has been 171.65 points, or 13.2% of the 1,301.66-point leg from 1,505.68, which sits between the high and the 0.236 at 2,500.15. Correcting a third of the way to the first retracement rung is what strong advances do; a weekly close under 2,600.15 would say this one is not strong.
Advertisement
Measured Move and What Each Side Needs
The bull case is a weekly close above the 2,807.34 high, which would be the first since January and would open the measured move: the box that contained the five-week coil measures 2,668.00 minus 2,387.28, or 280.72 points, projecting 2,948.72. Above that, the 1.272 extension of the whole 1,505.68 - 2,807.34 leg sits at 3,161.39, but that is a first-quarter 2027 conversation. There is one caution to carry: the lid was built on 1.14x and 1.19x weeks, the breakout week printed only 1.03x, and this week is lighter still. A breakout that is not accompanied by a 1.5x-2x week is the kind that gets retested, which is exactly what the market has spent the last two weeks doing.
The bear case starts with the close, not the wick. A weekly close under 2,635.69 puts the 2,600.15 low of the breakout week in play, and a close under that turns the whole move into a failed break: below 2,600.15 there is a 100-point gap to the 0.236 at 2,500.15 and then very little until the 0.382 at 2,310.11, which is the measured destination if the leg unwinds. The average weekly range over the last 20 weeks is 221.26 points, or 8.12% of spot, so one ordinary week can travel from 2,613 to 2,945 — which is why the weekly close is the signal and the intraday prints are noise. A close back above 2,807.34 cancels the bear read entirely and hands the market the 2,948.72 count.
Written by
EarnCrypto.dev Editorial
The EarnCrypto.dev editorial team researches and reviews AI mining platforms, pools and earning tools — publishing only what passes our own checks.
Related reading

SOL Weekly Analysis — A 17-Week Doubling Topped Twice at 124.95 / 123.76: The 116.32 Neckline Decides 124.95 or 100.19
SOL doubled 107.8% in 17 weeks into a 124.95 / 123.76 two-touch top and paid its 108.29 count to 105.71. The 116.32 neckline decides 124.95 or 100.19.

AVAX Weekly Analysis — A 55.2% Thrust and Four 2x-Volume Weeks Under a 12.008 Two-Touch Top: The 10.866 Retrace Decides 14.25 or 8.387
AVAX ran a 55.2% week on 2.27x volume, then coiled four weeks under an 11.799 / 12.008 two-touch top. The 10.866 line decides 14.25 or the 8.387 count.

ETH Daily Analysis — A 2,392.96 Count 94% Filled and Five Rising Lows Back at the 0.382: The 2,635 Line Decides 2,777 or 2,406
ETH's 2,807/2,600 distribution left a 2,392.96 count that went 94% filled at 2,406.11. Five rising lows have retaken the 0.382 — 2,635 decides 2,777 or 2,406.