
ETH Monthly Analysis — A Higher Low at 1,505.68 and Four Rising Monthly Lows: The $2,807 Gate Decides 2,932 or 2,356
Ether printed a higher low at 1,505.68 in June and has closed three months green, landing on the 0.618 of the 2026 decline. Above 2,807.34 opens 2,932.
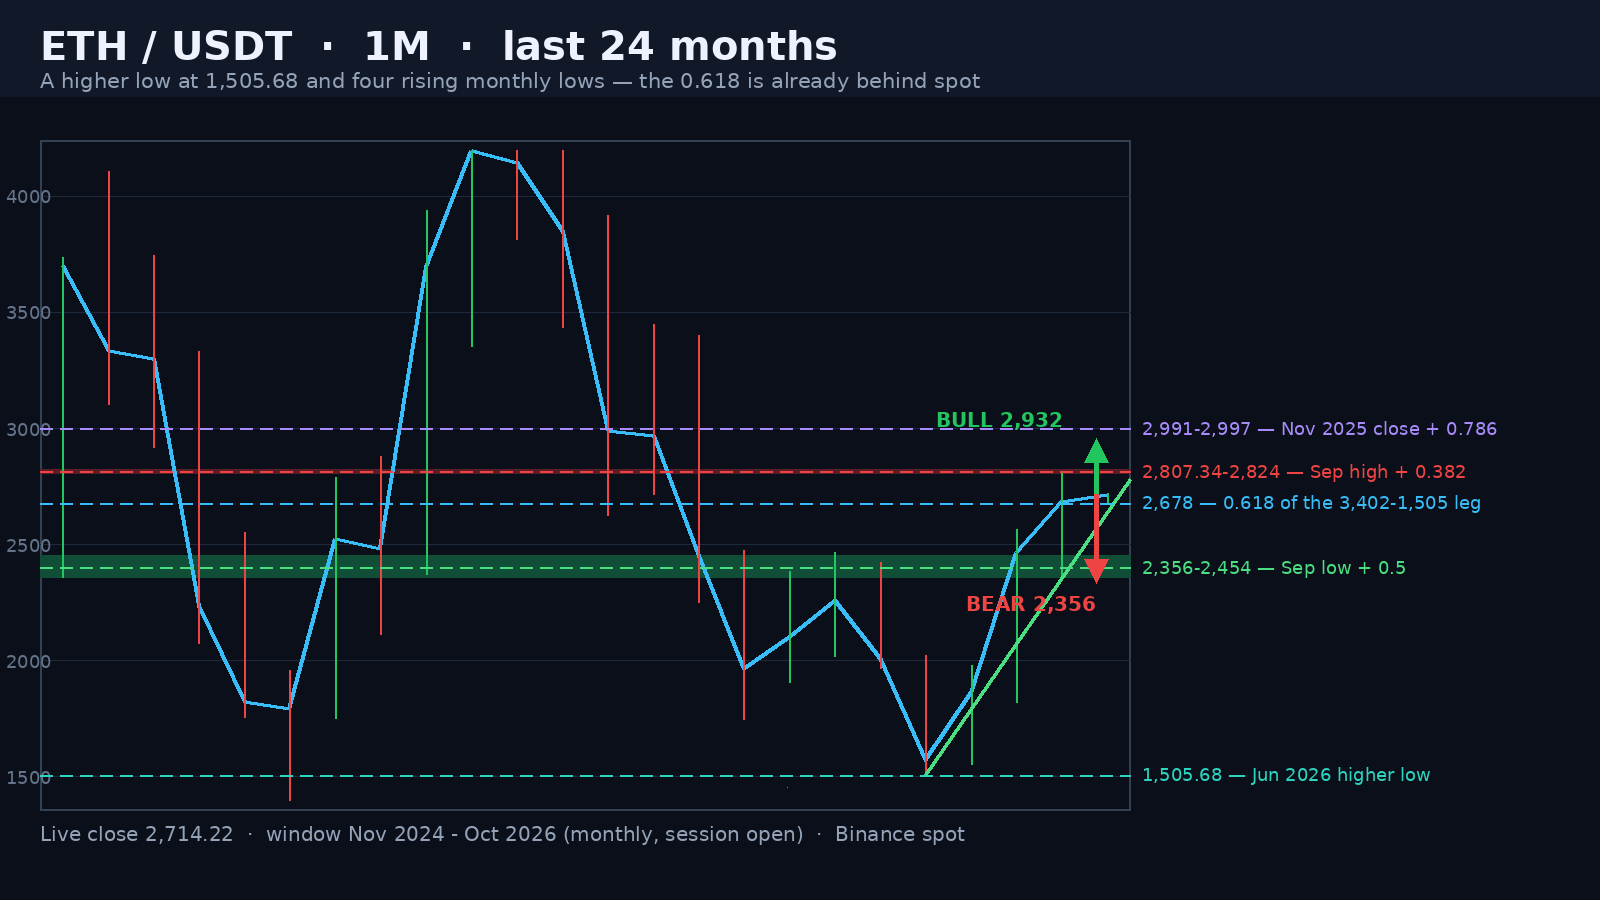
Ethereum is trading at 2,716.08 one day into the October monthly candle, 45.2% under the all-time high of 4,956.78 printed in August 2025 and 80% above the June 2026 low of 1,505.68. October has traded a 43.46-point range, 1.60% of spot, against a 14-month average monthly range of 696.26 points — 25.66% of spot — so the current quiet is a pause, not a regime. The monthly sequence is what matters here: September closed 2,686.01, August 2,467.65, July 1,862.60. Three consecutive green months off the June low, each one closing above the last, and each one landing on a Fibonacci level of the decline that preceded it.
A Higher Low, Fourteen Months and 120 Points Apart
The June 2026 low printed 1,505.68. The previous cycle low was 1,385.05 in April 2025 — 120.63 points lower, fourteen months earlier. Ethereum did not retest it. Instead it printed a higher low, and then did something rarer at a monthly scale: four rising consecutive monthly lows, 1,505.68 in June, 1,552.92 in July, 1,822.06 in August and 2,356.41 in September. The rail climbs 283.58 points a month and the October low of 2,678.54 is sitting on the projected line rather than under it. It is the first run of four consecutive higher monthly lows since June to September 2025, when the same structure carried Ethereum from 2,111.89 to 3,815.00.
Advertisement
Every Monthly Close Has Landed on the Fibonacci Ladder
This is the part of the chart that looks engineered. The 2026 decline ran from the January high of 3,402.89 to the June low of 1,505.68 — 1,897.21 points. Its retracements are 1,953.42 at the 0.236, 2,230.41 at the 0.382, 2,454.29 at the 0.5, 2,678.16 at the 0.618 and 2,996.87 at the 0.786. Line those up against what actually happened: the July high printed 1,981.24 against the 0.236, the January low sat at 2,250.00 against the 0.382, the April high printed 2,464.91 and the August close 2,467.65 against the 0.5, the September close was 2,686.01 against the 0.618, and November 2025 closed 2,991.26 against the 0.786. Five levels, five real prints — four of them within twenty points and the widest by twenty-eight. The market is trading this decline by the book, which makes the next rung — 2,996.87 — the first place the recovery can be tested rather than celebrated.
The Gate Is 2,807.34, and the 0.382 Behind It
September topped at 2,807.34 and closed 121.33 points under its own high. That high is the first number on the screen because it is also the 0.382 retracement of the entire bull-market leg: 4,956.78 down to 1,505.68 is 3,451.10 points, and its 0.382 lands at 2,824.00 — seventeen points above September's high. So the gate and the retracement sit in the same eighteen-point band, and August's breakout is bracketed by it. The measured move agrees: the June-July base is 1,505.68 to 1,981.24, 475.56 points, so one projection lands at 2,456.80 which the market already filled in August, two projections land at 2,932.36, and three land at 3,407.92 — within five points of the January 2026 high of 3,402.89.
Advertisement
What Each Side Needs
The bull case starts at a monthly close above 2,807.34. That clears the September high, the 0.382 of the ATH leg and the 2,824 band in one move, and the two-projection target at 2,932.36 is the first objective — after that, 2,991.26/2,996.87 where the November 2025 close and the 0.786 of the decline meet. Above them the road is 3,231.23 (the 0.5 of the ATH leg), 3,300.99 (the 2025 January close), 3,402.89 (the January high, and the three-projection target) and 3,447.44 (the December 2025 high). The bull case stops working on a monthly close under 2,678.16 — the 0.618 that every recent close has been anchored to. Note the volume: 8.94 million ETH traded in September, 0.62x the 20-month average, so the advance is thin and the 2,807 gate is exactly where thin advances get tested.
The bear case is the same map read downward. A monthly close under 2,678.16 hands the market back to the 0.5 at 2,454.29, where the April high of 2,464.91 and the August close of 2,467.65 already sit as overhead supply. Under that, the September low of 2,356.41 is the last support of the sequence — losing it breaks the rising-lows rail that has held for four months — and the July high of 1,981.24 and the August low of 1,822.06 are the next real shelves before the June floor at 1,505.68. With a 14-month ATR of 696.26 points, 25.66% of spot, the distance between the two triggers is less than one average month, so the close is the signal and the intraday print is noise. Probability still leans up — four rising lows and three green closes — but this is a market that has to earn the gate, not one that gets it for free.
Written by
EarnCrypto.dev Editorial
The EarnCrypto.dev editorial team researches and reviews AI mining platforms, pools and earning tools — publishing only what passes our own checks.
Related reading

SOL Weekly Analysis — A 17-Week Doubling Topped Twice at 124.95 / 123.76: The 116.32 Neckline Decides 124.95 or 100.19
SOL doubled 107.8% in 17 weeks into a 124.95 / 123.76 two-touch top and paid its 108.29 count to 105.71. The 116.32 neckline decides 124.95 or 100.19.

AVAX Weekly Analysis — A 55.2% Thrust and Four 2x-Volume Weeks Under a 12.008 Two-Touch Top: The 10.866 Retrace Decides 14.25 or 8.387
AVAX ran a 55.2% week on 2.27x volume, then coiled four weeks under an 11.799 / 12.008 two-touch top. The 10.866 line decides 14.25 or the 8.387 count.

ETH Daily Analysis — A 2,392.96 Count 94% Filled and Five Rising Lows Back at the 0.382: The 2,635 Line Decides 2,777 or 2,406
ETH's 2,807/2,600 distribution left a 2,392.96 count that went 94% filled at 2,406.11. Five rising lows have retaken the 0.382 — 2,635 decides 2,777 or 2,406.