
ETH Daily Analysis — Lower Highs From 2,807 Over Rising Lows Off 2,600: The 2,748.60 Rail Decides 3,014 or 2,393
Ether is coiled 3.3% under its 2,807.34 high: four lower highs against four higher lows, and the 2,748.60 rail decides a 3,014.53 breakout or a 2,392.96 slide.
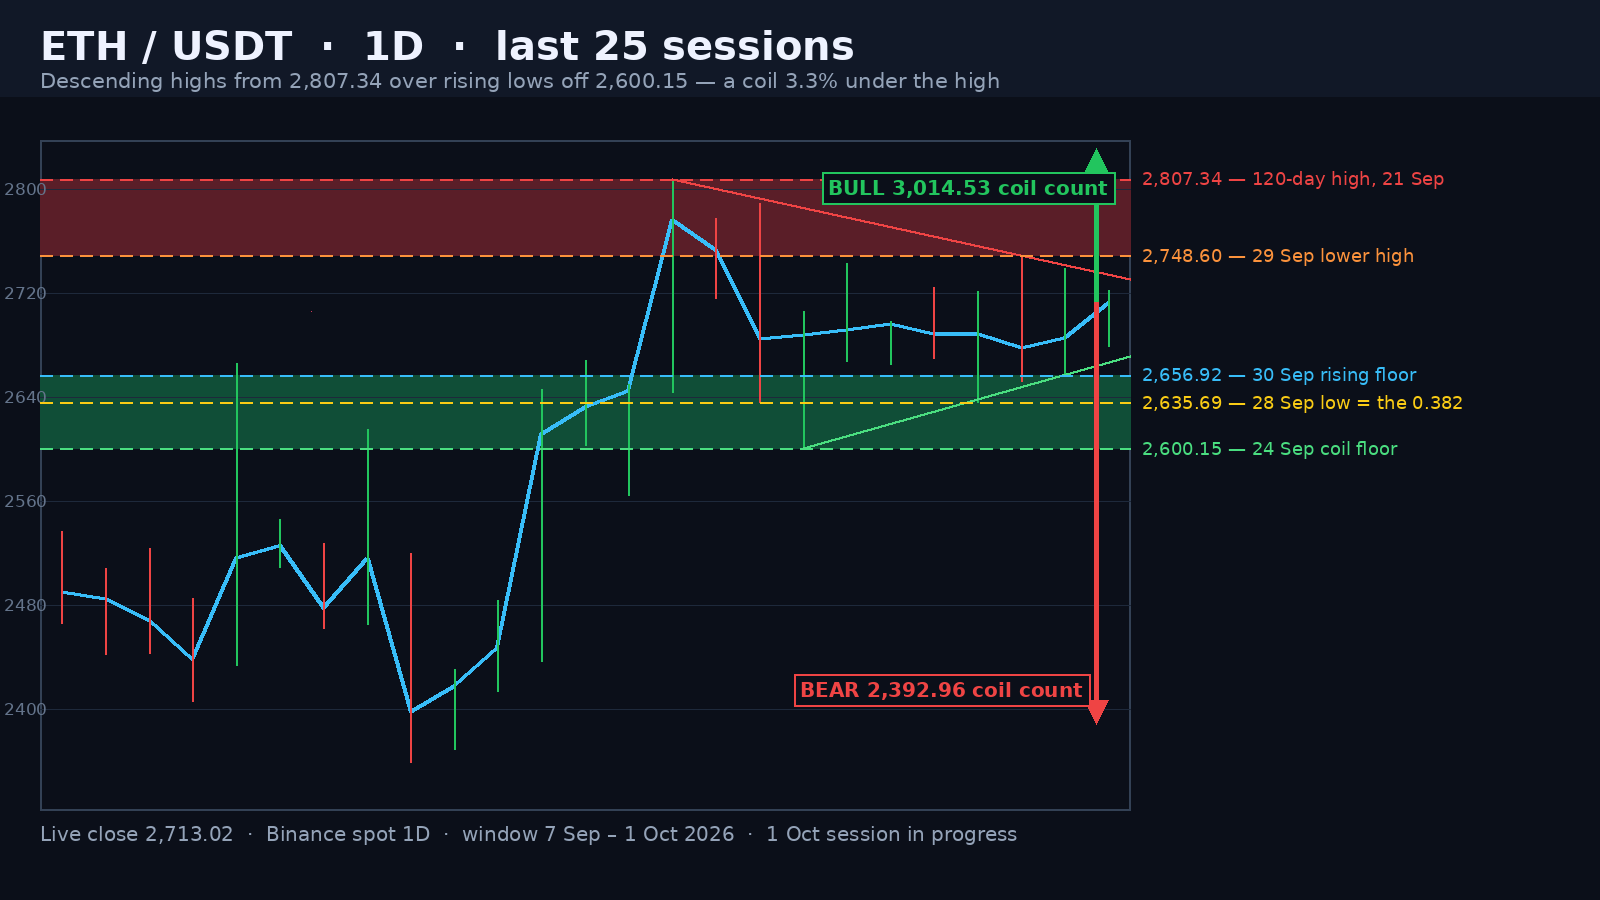
Ether is trading at 2,714.76 in the 1 October session, 3.30% under the 2,807.34 high it set on 21 September. That high is still the 120-day top, and in the ten sessions since, every rally has stopped lower and every dip has stopped higher. Today's range so far is 43.46 points, 1.60% of spot, on a 0.18x full-day volume pace against the 20-day average of 305,642 ETH. A converging coil, 93 points under its ceiling.
The Ceiling: 2,807.34, 2,789.00, 2,748.60, 2,738.51
21 September was the session that made the top: 573,090 ETH of volume — the heaviest print since 11 September's 639,602 — and a close at 2,776.19. The first test came on 23 September at 2,789.00, below the high. Then 29 September at 2,748.60, then 30 September at 2,738.51. That is four descending prints, each one snapping back before it reached the last, and not a single close above 2,789.00 anywhere in the stretch. Context matters: the 21 September candle is the heaviest thing in this window since 11 September, which is exactly what a blow-off print looks like — and why the follow-through has been so laboured.
Advertisement
A falling ceiling on its own is a distribution signal. What makes this a coil instead is the other side of the tape: the lows have climbed the whole way. 24 September printed 2,600.15. 28 September 2,635.69. 29 September 2,652.20. 30 September 2,656.92. And the current session has not traded under 2,678.54. Four consecutive higher lows buying against four consecutive lower highs is a market compressing, not a market distributing — and it is why both scenarios below are drawn off the rails rather than off a directional bias.
The 2,635.69 Low Tagged the 0.382 to Within a Third of a Point
Measure the September impulse from the 2,358.88 low of 15 September to the 2,807.34 high of 21 September, and the 0.382 retrace sits at 2,636.03. On 28 September Ether traded down to 2,635.69 — a 0.34-point tag of the level — and closed 53 points above it at 2,688.71, on 291,824 ETH. Since then the floor has only risen. That is the single most bullish fact in this chart: the deepest pullback of the whole move stopped on a real retracement level and was bought, not broken. If the 0.382 had failed, the 0.5 at 2,583.11 and the 0.618 at 2,530.19 would already be in play.
Advertisement
The 2,748.60 Rail Is the Decision
The BULL case needs a daily close back above 2,748.60 — the 29 September lower high, and the second anchor of the ceiling rail that runs down from 2,807.34. From there the path is 2,789.00, then the top itself. A decisive close above 2,807.34 takes the whole 21 September – 1 October range — 2,600.15 to 2,807.34, 207.19 points — and projects it upward to 3,014.53. That is the measured move, not a prediction: 2,900 comes first and it would take a further 3.5% on top of the breakout.
The BEAR case starts with losing 2,656.92 and then 2,635.69, the 0.382. Under the 2,600.15 coil floor the same 207.19-point count projects 2,392.96, with the 0.5 retrace at 2,583.11 sitting in between as the obvious shelf to watch for the first bounce. The invalidation is clean on both sides and worth stating plainly: a daily close above 2,789.00 kills the bearish read, and a daily close below 2,635.69 kills the bullish one. Nothing in between has resolved anything this week.
Context: Ten Straight Closes Above the 20-Day Average
Ether has closed above its own 20-day average in each of the last ten sessions, and that average sits at 2,620.88 — 94 points below the current price. The 50-day is 2,453.05. The 7-day change is +0.9% and the 30-day is +12.2%. ATR(14) is 93.90, or 3.46% of spot, which is the number that matters for the next few sessions: one average daily candle can travel the distance from the close to the 2,748.60 rail and back without changing the structure at all.
The chart above freezes the last 120 daily sessions from Binance spot. The path of least resistance is still upward — a coil 3.3% under a 120-day high is a pause, not a top — but converging structure resolves in both directions and the two rails are closing on each other. The gap to the 2,748.60 rail is 34 points; the gap down to the 2,635.69 shelf is 79. The first daily close outside that band is the tell, and whoever is long here is being paid to wait, not to guess.
Written by
EarnCrypto.dev Editorial
The EarnCrypto.dev editorial team researches and reviews AI mining platforms, pools and earning tools — publishing only what passes our own checks.
Related reading

SOL Weekly Analysis — A 17-Week Doubling Topped Twice at 124.95 / 123.76: The 116.32 Neckline Decides 124.95 or 100.19
SOL doubled 107.8% in 17 weeks into a 124.95 / 123.76 two-touch top and paid its 108.29 count to 105.71. The 116.32 neckline decides 124.95 or 100.19.

AVAX Weekly Analysis — A 55.2% Thrust and Four 2x-Volume Weeks Under a 12.008 Two-Touch Top: The 10.866 Retrace Decides 14.25 or 8.387
AVAX ran a 55.2% week on 2.27x volume, then coiled four weeks under an 11.799 / 12.008 two-touch top. The 10.866 line decides 14.25 or the 8.387 count.

ETH Daily Analysis — A 2,392.96 Count 94% Filled and Five Rising Lows Back at the 0.382: The 2,635 Line Decides 2,777 or 2,406
ETH's 2,807/2,600 distribution left a 2,392.96 count that went 94% filled at 2,406.11. Five rising lows have retaken the 0.382 — 2,635 decides 2,777 or 2,406.