
ETH Daily Analysis — Five Lower Highs Into a 50-Point Triangle: 2,232 or 2,383 Decides the Break
ETH has printed five lower highs over a flat 2,282.46 base since 21 October, and the 50-point triangle resolves to 2,232.18 on a break or 2,383 on a reclaim.
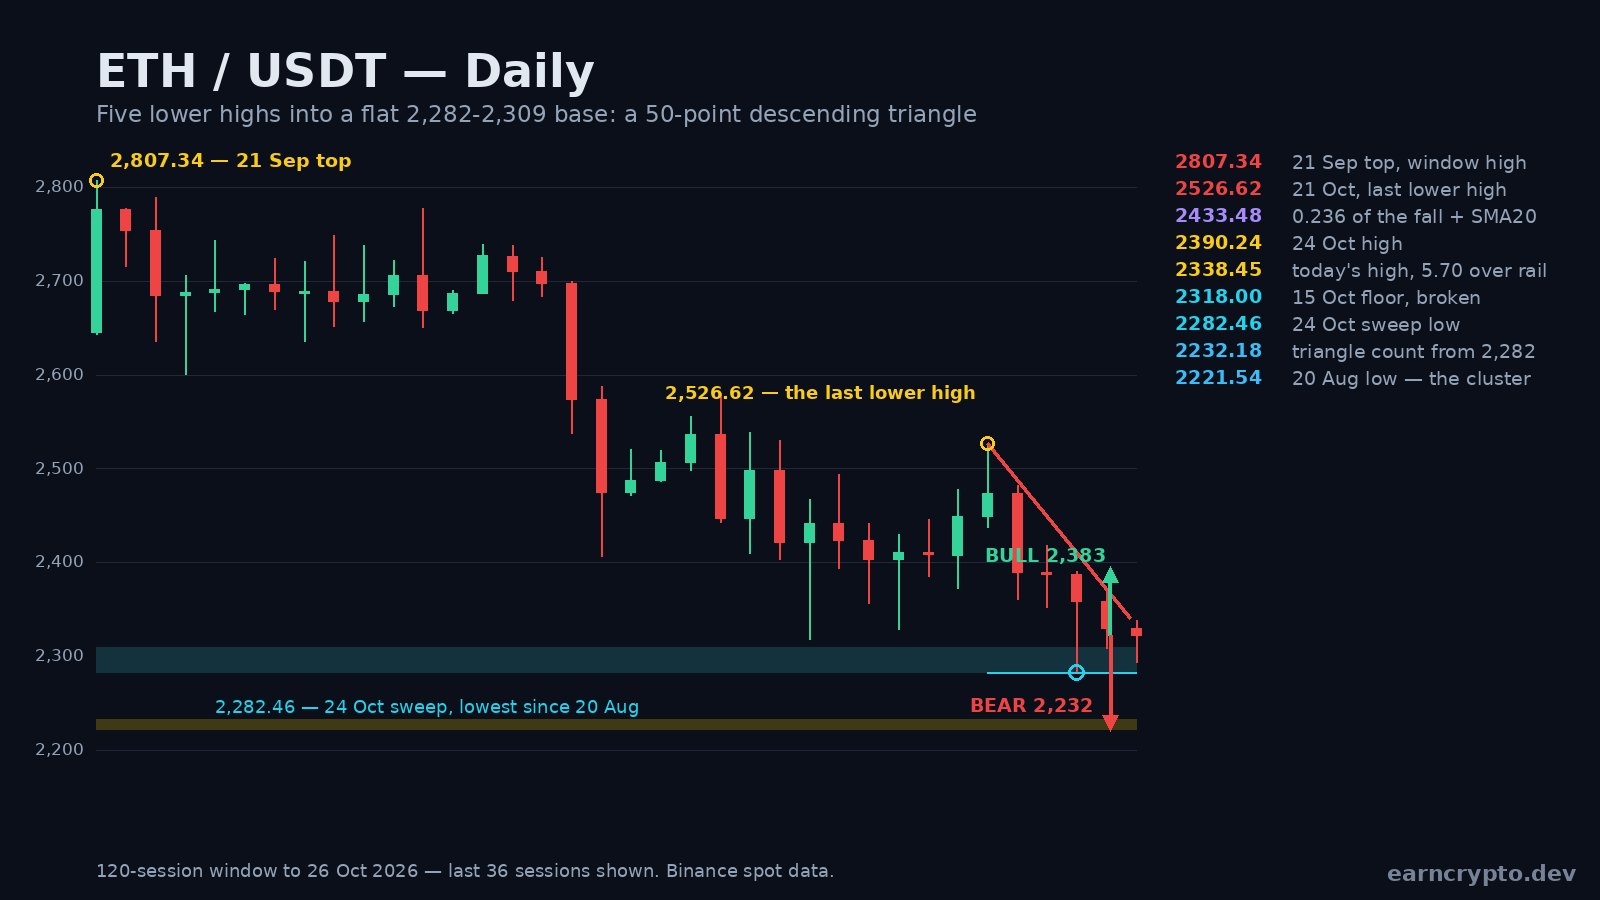
Our 22 October note framed this market with one line: 2,433.48 decides 2,565 or 2,318.00. The tape took the second option inside four sessions. The 22 October close came in at 2,389.14, 44.34 under the 0.236, and the three levels that note listed on the way down — 2,372.62, 2,329.00 and 2,318.00 — all printed by Saturday. The floor at 2,318.00 was not merely tested: it was swept to 2,282.46, the lowest print since 20 August.
What has replaced it is not a waterfall but a compression. Price last traded at 2,320.69, 2.69 above the level it broke, with today's candle covering 45.36 points from 2,293.09 to 2,338.45 — 47% of the fourteen-day ATR of 96.58 — on 56,994 ETH, a 0.22x pace against the twenty-day average of 254,138. Slower tape under a broken floor is the shape of a market that has stopped agreeing with itself, and the chart has the geometry to prove it. Live depth on Binance's ETH/USDT pair shows the same thinning book.
Advertisement
The Ceiling Falls 38.78 a Session
Draw the ceiling through the 21 October high at 2,526.62 and the 25 October high at 2,371.52: it drops 38.77 points per session and reads 2,332.74 for today. The highs in between did not wait for it — 2,482.49 printed 5.36 under the rail, 2,417.77 printed 31.31 under it, 2,390.24 printed 20.06 under it — which means the sequence is falling faster than the line that describes it. The count is five consecutive lower highs: 2,482.49, 2,417.77, 2,390.24, 2,371.52, 2,338.45. Today's high at 2,338.45 is the first to poke above the rail, by 5.70 points, and the close came back 12.05 under it. A wick over a falling line is not a reclaim.
The Base Is Flat, and Three Closes Have Refused It
The base is not a line but a 26.24-point band, and it has been paid three times in three sessions: lows of 2,282.46 on 24 October, 2,308.70 on 25 October and 2,293.09 today, with closes of 2,358.82, 2,329.87 and 2,320.69 — every one of them back above 2,318.00. That is the whole bull case in one sentence. The volume behind it is the reason to take it seriously: the 24 October session ran at 0.78x its own twenty-day average, the 25th at 0.45x, and today is a 0.22x pace. The 15 October sweep that first marked this floor came on 446,113 ETH, 1.81x and the heaviest print of the last thirty sessions. Sellers were paid down there once and have not returned with size.
Advertisement
50.29 Points of Height and One Week to Resolve
Measured at today's index the triangle is 50.28 points tall — the rail at 2,332.74 against the base at 2,282.46. Down: a daily close under the base activates that height and projects 2,232.18, and the flag measure from today's high (2,338.45 less 2,282.46 is 55.99) projects 2,226.47. The 20 August low sits at 2,221.54, 10.64 under the first target and 4.93 under the second, and the 1.272 extension of the 2,318.00 bounce lands at 2,261.26. That is four references inside 40 points, which is the kind of cluster a market pays attention to. Up: the same height added to the rail gives 2,383, with the 24 October high at 2,390.24 — 7.21 higher — as the first real print above it.
The convergence is not an accident of drawing: the rail falls 38.77 a session and the base has held for three, so the two lines meet in about 1.3 sessions, around 28 October. Triangles resolve because there is nothing left to test, and this one is four sessions from having no room at all.
Momentum Has Not Chosen Either
Twenty consecutive closes have printed under the twenty-day mean, now 2,437.13, which is 116.44 above the market; the fifty-day sits at 2,540.84, 220.15 higher. That is a distribution, and it is why the path of least resistance is still down. The counterweight is that the 0.236 of the 489.34-point fall is 2,433.48 — 4.29 under the twenty-day mean — so the first reclaim target is one wall, not two, and a close above 2,433.48 would put both behind price. The retracement ladder above runs 2,504.93 at the 0.382, 2,562.67 at the 0.5 and 2,620.41 at the 0.618; the 21 October bounce died 42.6% of the way up the fall, under the 0.5.
What Invalidates Each Side
The bear case dies on a daily close above 2,371.52, the 25 October high: that breaks the five-session run of lower highs and puts 2,390.24 and then the 2,433.48 wall in play. The bull case dies on a daily close under 2,282.46, which would be the lowest close since 21 August and would hand the tape 2,232.18 followed by 2,221.54. I would call it 55/45 for the base holding on a closing basis, and the reason is the three refusals rather than the geometry — but a base defended on wicks with 50 points of measured height above it is not a bottom, it is a decision.
Two numbers settle this week: 2,282.46 at the base and 2,332.74 at the rail, with the apex a session or two behind them. Level arithmetic on the way to a decision is on the site's crypto converter.
Written by
EarnCrypto.dev Editorial
The EarnCrypto.dev editorial team researches and reviews AI mining platforms, pools and earning tools — publishing only what passes our own checks.
Related reading
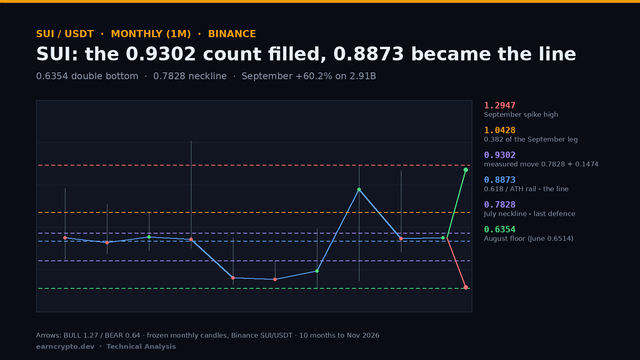
SUI Monthly Analysis — A 0.6354 Double Bottom Filled Its 0.9302 Count: The 0.8873 Retrace Decides 1.0428 or 0.7828
SUI filled the 0.9302 count of its 0.6354 double bottom at September's high and gave 22.8% back in October. The 0.8873 retrace now decides 1.0428 or 0.7828.
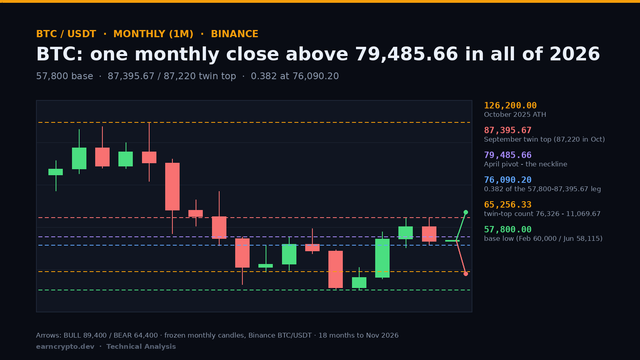
BTC Monthly Analysis — A Single 2026 Close Above 79,485.66 and an 87,395.67 Twin Top: 76,090 Decides 89,400 or 65,256
BTC closed October at 77,582, -7.2% under its open and back below the 79,485.66 pivot. The 76,090.20 retrace now decides whether 89,400 or 65,256 comes first.
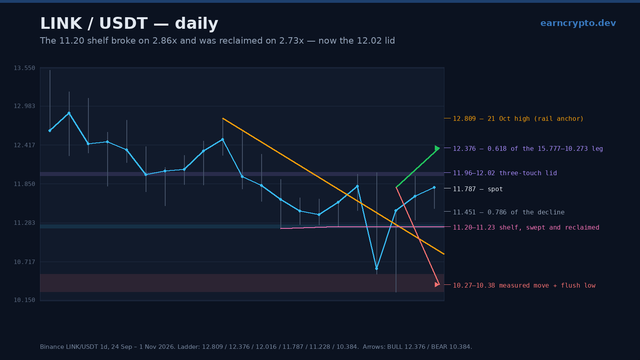
LINK Daily Analysis — The 11.20 Shelf Broke on 2.86x and Was Reclaimed on 2.73x: The 12.02 Lid Decides 12.38 or 10.38
Chainlink swept the 11.20 shelf on 2.86x volume, reversed the whole break on 2.73x and now fights a three-touch 11.96-12.02 lid. 12.02 decides 12.38 or 10.38.