
ETH Daily Analysis — A Five-Session 2,282.46–2,391.55 Box Broke on 1.80x and Filled Its 109.09 Count: 2,282.46 Decides 2,391.55 or 2,072.52
ETH broke a five-session 2,282.46–2,391.55 box, filled the 109.09 count at 2,173.37 and swept the 0.618 at 2,229.58. 2,282.46 decides 2,391.55 or 2,072.52.
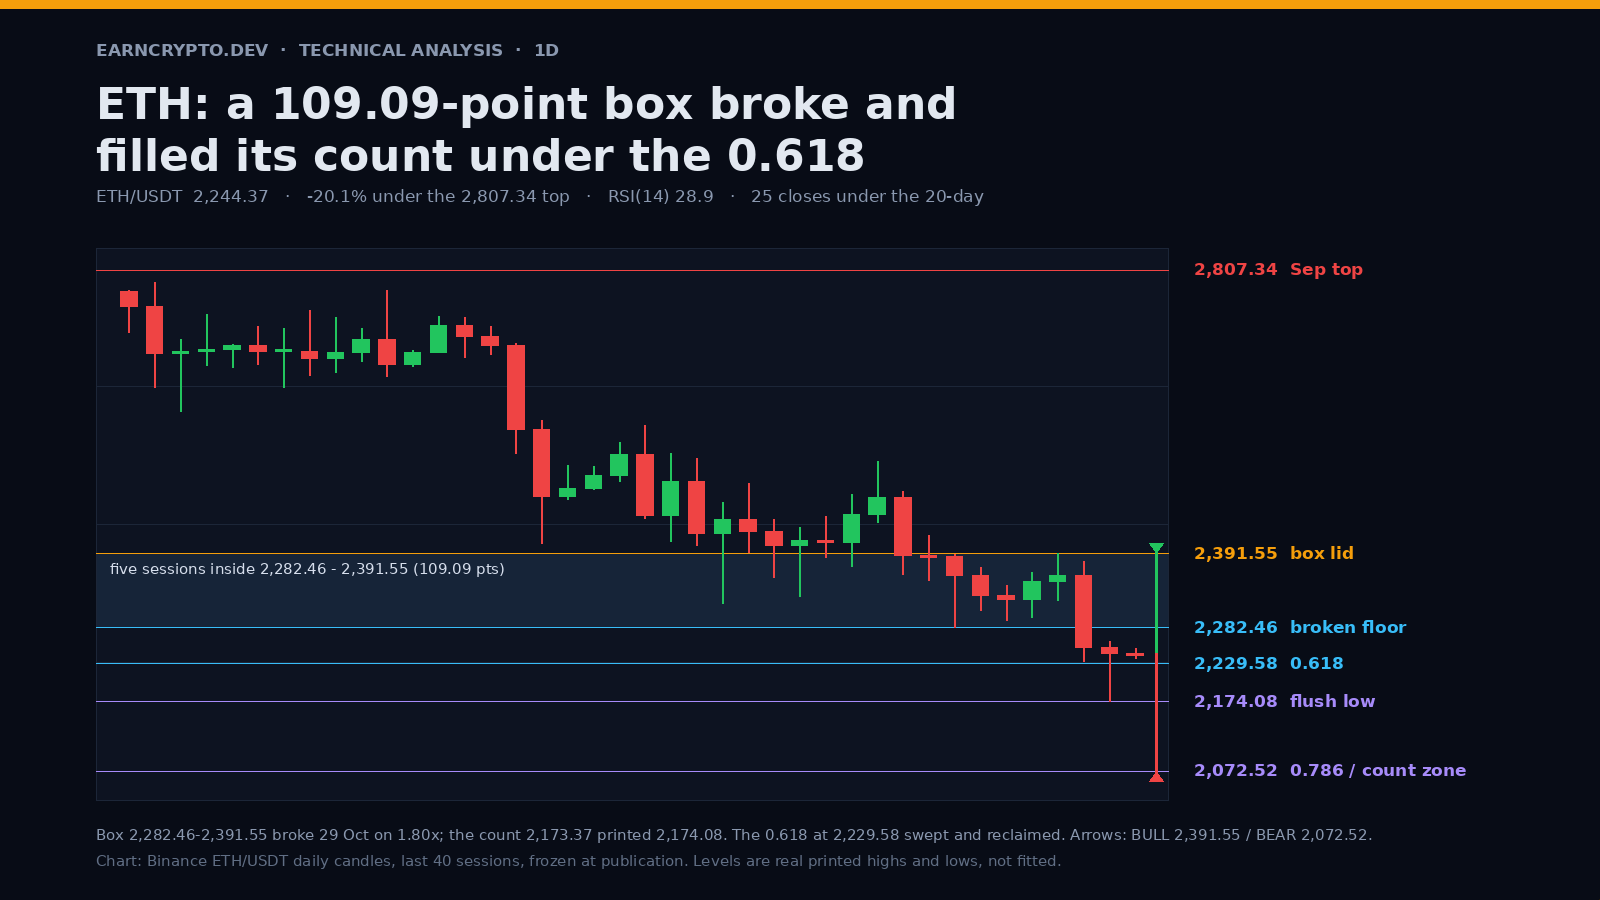
The lowest close since 18 August
Ether opened the session at 2,245.54, tagged 2,252.62, printed 2,237.00 and settled at 2,244.39 — a 15.62 range and the lowest daily close the pair has recorded since 18 August 2026, the day it closed at 1,917.85 on the way into the August vertical move. Every close between that day and Thursday sat above today's.
The last five weeks are enough. Since the 2,807.34 top on 21 September the highs have stepped down four times: 2,777.33 on 2 October, 2,579.88 on 12 October, 2,526.62 on 21 October and 2,391.55 on 28 October — the last three consecutive, each one lower than the one before it. Twenty-five consecutive closes have now printed under their own 20-day average, which currently sits at 2,380.98, and the daily RSI is 28.9.
Advertisement
That is what a downtrend looks like when nobody is in a hurry. The 50-day at 2,522.02 is 277.63 away, spot is 6.1% under the 20-day, and the 14-day average true range of 82.41 points is 3.67% of spot — a market that is grinding, not crashing.
Five sessions inside 109 points, then two of selling
From 24 to 28 October the whole of the price action fit between two prints: a floor at 2,282.46 and a lid at 2,391.55. Five sessions, five lows between 2,282.46 and 2,323.20, five highs between 2,344.72 and 2,391.55, and a 109.09-point box — 4.8% of spot — that the market could not resolve on its own. On 29 October it resolved: a 2,359.69 open, a 2,379.55 high, a 2,233.00 low and a 2,253.13 close, on 412,039 ETH, which is 1.80x the twenty-day average for that session.
Advertisement
The follow-through came the next day rather than the same one — 30 October printed 2,174.08 before closing 2,245.54 on 463,451 ETH, 1.93x the average. Two consecutive sessions of above-average volume in the same direction is the part of this that matters. A single high-volume candle can be a stop run; two can still be a stop run, but less comfortably so.
The measured move of that box is now arithmetic rather than forecast. 2,391.55 minus 2,282.46 is 109.09 points; projected from the broken floor, that is 2,173.37. The low of 30 October printed 2,174.08 — 0.71 points above the target. The break has been paid. Whatever happens next needs a new level, because the box has given everything it had.
The 0.618 was swept and reclaimed in the same session
Under the box sat the 0.618 retracement of the entire August advance — the 1,872.46 low of 17 August to the 2,807.34 high of 21 September, a 934.88-point leg — which puts the level at 2,229.58. The 30 October wick traded 55.50 under it. The same candle closed 15.96 above it.
The flush low sits 55.50 points under that 0.618, and one 14-day average true range is 82.41 points, so the whole excursion fits inside a single average session. In the language of this chart, that is a sweep and not a repricing: the last buyers' line was tested and defended on a closing basis, and the only thing the sellers got for two sessions of above-average volume was a wick.
It is worth being precise about how weak that defence is. A reclaim on the same candle that broke the level is the minimum a market can do; it is not a reversal signal. The 0.618 has to hold for several sessions and then be left behind — and above it the 0.5 at 2,339.90 is still almost a hundred points away.
2,282.46 is the line, 2,072.52 is the count beneath it
The broken box floor at 2,282.46 is where the argument is now. It is 1.7% above spot and it is the first price a bounce has to reclaim to make the two-session break look like a liquidity grab. Above it the box height projects straight back to 2,391.55 — the 28 October lower high and the lid of the same box — so a reclaim and a close above the lid are the same trade twice. Above 2,391.55 the 0.382 at 2,450.22 becomes the real test, and the four-step sequence of lower highs is over.
Below the 30 October low the levels are just as concrete. The 0.786 of the same August leg sits at 2,072.52 — the last retracement before the whole advance is round-tripped. And the downleg from the 2,391.55 lid to the 2,174.08 flush is 217.47 points; measured from a failed reclaim of 2,282.46, it projects 2,064.99. Two independent calculations landing inside nine points of each other at 2,064.99–2,072.52 is the strongest bear confluence this chart has offered since the top.
The two paths from 2,244.39
Bull: the first job is a close back above 2,282.46, and the honest shape of it includes a failing attempt first — a wick through the level, a rejection, a retest of 2,240 that holds. From there 2,339.90 (the 0.5) and then 2,391.55 are the objectives, and a close above 2,391.55 is what invalidates the bear case rather than the touch. The path of least resistance is still down, so treat this as the repair scenario with the lower probability of the two until the volume profile of a rally matches the volume profile of the drop.
Bear: the motion is already in place and the box count is spent, which is the uncomfortable part — the next leg has no measured move behind it. A daily close under 2,174.08 opens 2,072.52 with 2,064.99 sitting almost exactly underneath as a projection. Expect chop on the way: a bounce to 2,229.58 from below, a rejection at the 0.618, a lower high at 2,282.46, then a sweep of 2,174.08 — markets do not travel in straight lines even when the structure is broken.
The box broke, the count filled to within 0.71 points, and the 0.618 was swept and reclaimed on the same candle. Neither side has won; 2,282.46 is where they settle it.
ETH is quoted here from Binance ETH/USDT, with the same daily candles on TradingView and market-cap context on CoinGecko. Levels are real printed highs and lows; the scenarios are projections, not forecasts.
Written by
EarnCrypto.dev Editorial
The EarnCrypto.dev editorial team researches and reviews AI mining platforms, pools and earning tools — publishing only what passes our own checks.
Related reading
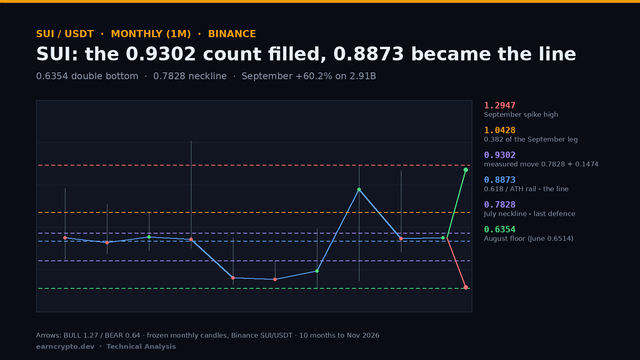
SUI Monthly Analysis — A 0.6354 Double Bottom Filled Its 0.9302 Count: The 0.8873 Retrace Decides 1.0428 or 0.7828
SUI filled the 0.9302 count of its 0.6354 double bottom at September's high and gave 22.8% back in October. The 0.8873 retrace now decides 1.0428 or 0.7828.
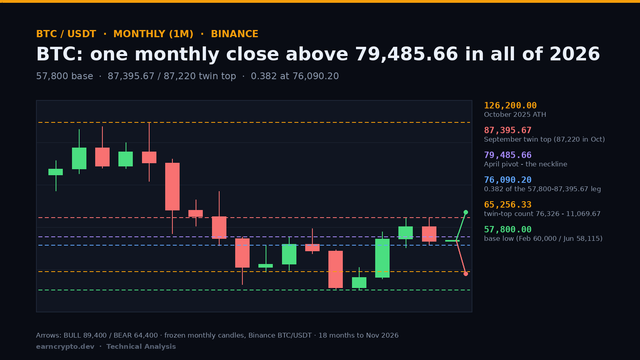
BTC Monthly Analysis — A Single 2026 Close Above 79,485.66 and an 87,395.67 Twin Top: 76,090 Decides 89,400 or 65,256
BTC closed October at 77,582, -7.2% under its open and back below the 79,485.66 pivot. The 76,090.20 retrace now decides whether 89,400 or 65,256 comes first.
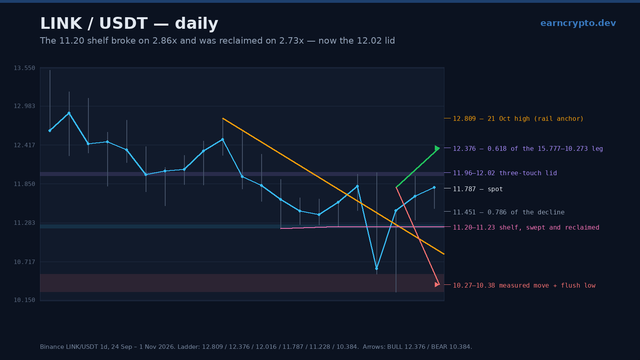
LINK Daily Analysis — The 11.20 Shelf Broke on 2.86x and Was Reclaimed on 2.73x: The 12.02 Lid Decides 12.38 or 10.38
Chainlink swept the 11.20 shelf on 2.86x volume, reversed the whole break on 2.73x and now fights a three-touch 11.96-12.02 lid. 12.02 decides 12.38 or 10.38.