
DOGE Weekly Analysis — Two Pushes Above $0.10 Over Four Higher Weekly Lows: The 0.09129 Retrace Decides 0.11861 or 0.07831
Dogecoin weekly: four higher weekly lows off the 0.06766 July low, and two failed pushes above $0.10 in 19 weeks without a close there. 0.09129 decides.
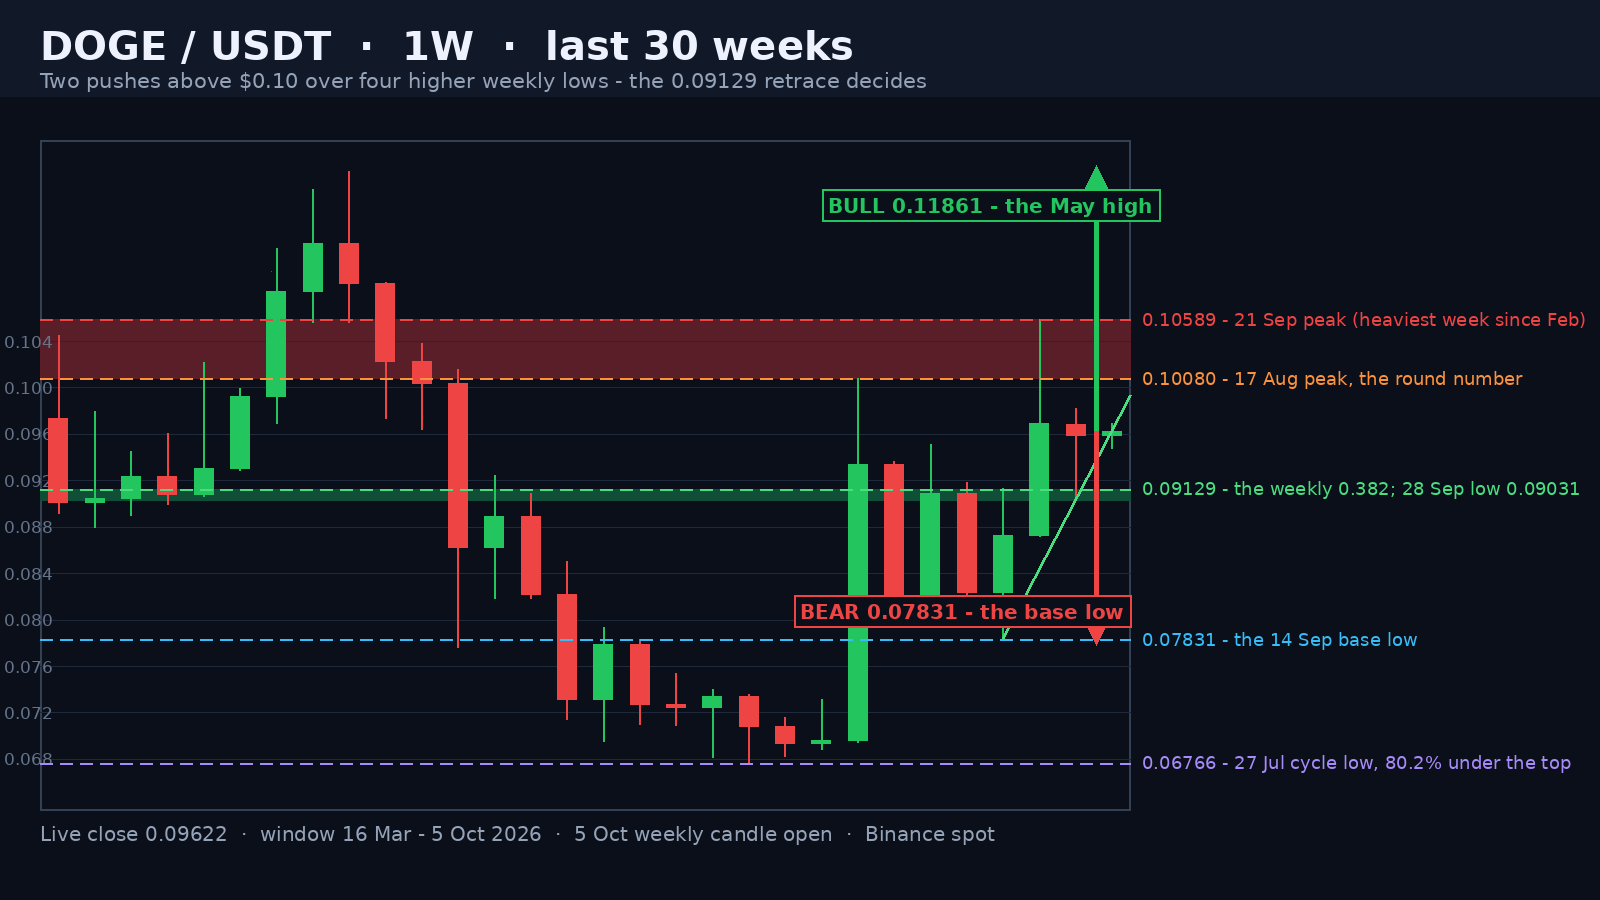
Dogecoin closed the week of 28 September at 0.09591 and is trading 0.0965 in the opening hours of the 5 October week — 80.1% under the 0.48434 all-time high of December 2024, 42.7% above the 0.06766 cycle low of 27 July, and 3.5% under the $0.10 round number. The weekly chart has spent the ten weeks since that low building the first real base of this bear market. The floor has lifted in each of the last four weeks — 0.07831, then 0.08722, 0.09031 and 0.09475 so far this week — while the ceiling has been tested twice above the round number and has never once closed there. The number that matters is 0.09129: the 38.2% retracement of the whole 0.06766 - 0.10589 leg, which the 28 September week tagged to within 0.00098 before closing 0.00560 back above it.
Two Pushes Above $0.10 and Nineteen Weeks Without a Weekly Close There
The first push came in the week of 17 August, which opened 0.06960, ran to 0.10080 and closed 0.09342 — a 34.2% week on 8.61 billion DOGE, 1.97x the 20-week average of 4.37 billion. It closed 0.00738 under its own high, so even on a 1.97x week the round number was not held. The second push came five weeks later: the week of 21 September opened 0.08730, printed 0.10589 and closed 0.09690 on 10.30 billion DOGE — 2.35x the average and the heaviest weekly print since the week of 2 February. That second peak is 0.00509, or 5.0%, above the first, and it is the highest weekly print since the week of 18 May, when the market tagged 0.10910. Above both sits the ceiling that has defined this whole decline: 0.11861, printed in the week of 11 May. The last weekly close above $0.10 was 0.10041 on 25 May — nineteen weeks ago. A market that has failed twice above a round number in eight weeks, and has not closed a single week above it since May, is not a market that has broken out. It is a market that has built a lid.
Advertisement
Four Higher Weekly Lows Off the 0.06766 Cycle Low
Underneath, the base is doing the opposite of the lid. The week of 27 July printed the cycle low at 0.06766 — 86.0% under the December 2024 all-time high — on 2.67 billion DOGE, a 0.61x week, which is what capitulation looks like on this chart. From there the weekly lows read 0.06947, 0.08081, 0.08013, 0.08209, then 0.07831 in the week of 14 September, 0.08722, 0.09031 and 0.09475. The last four are strictly higher, and the lift from 0.07831 to 0.09475 is 0.01644, or 21.0%, in four weeks. The weekly closes tell the same story more cleanly: the last four are 0.08730, 0.09690, 0.09591 and 0.09600 — four consecutive closes above 0.087 for the first time since May. The 20-week mean sits at 0.08310, 15.5% under spot, and the 50-week mean at 0.10419 sits fractionally under the two peaks. The average and the 0.10080 - 0.10589 lid are the same line right now, which is exactly why this is the decision zone and not just another resistance level.
The 0.03823 Leg and the 72% Retrace That Was Bought
The leg that matters measures from 0.06766 to 0.10589 — 0.03823 points, or 56.5% in eight weeks. Its retracements are 0.236 at 0.09687, 0.382 at 0.09129, 0.5 at 0.08678, 0.618 at 0.08226 and 0.786 at 0.07584. The deepest weekly print on the way down was 0.07831 in the week of 14 September, which is 72.1% of the leg, and it was bought: that week closed 0.08730, back above the 0.618, and the three weekly lows since have never revisited it. Spot is now 0.00032 under the 0.236. That is the arithmetic which makes this a coil rather than a downtrend — the same leg that produced two failed pushes above $0.10 also produced a retrace that stopped a quarter of the way short of its origin and turned. Only one of the last nineteen weekly closes sits above 0.09687, and it cleared it by 0.00003: the 21 September week at 0.09690.
Advertisement
What Each Side Needs
The bull case starts with a weekly close above the 0.236 at 0.09687 — a level cleared once in nineteen weeks, and cleared by 0.00003. Above it the market has to take 0.10080 and then 0.10589, and only a weekly close over the September peak turns the base into a breakout: the pattern's own height, 0.10589 minus the 0.07831 base low, is 0.02758, projecting 0.13347, with the 18 May high at 0.10910 as the gate in between. Volume is the tell. The 21 September advance ran on 2.35x the average and the two weeks since have printed 1.19x and lighter, so a real break needs a week closer to 2x, not another 1.2x drift.
The bear case is nearer and simpler. A weekly close under 0.09129 breaks the 0.382 and puts the sequence 0.08678, 0.08226 and 0.07831 back on the table, with the 0.08722 low of the 21 September week as the first shelf. Only a weekly close under 0.07831 — the level the whole base is built on — activates the 0.02758 count, and that projects 0.05073, which is under the July cycle low and would be the most bearish weekly print of this entire bear market. Between spot and 0.07831 there is 18.4% of air, and the average weekly range over the last 20 weeks is 0.01130, or 11.8% of spot, so one ordinary week covers more than a third of that distance on its own. That is why the weekly close, and not the wick, is the only trigger here: a close back above 0.09687 cancels the bear read and hands the market the lid.
Written by
EarnCrypto.dev Editorial
The EarnCrypto.dev editorial team researches and reviews AI mining platforms, pools and earning tools — publishing only what passes our own checks.
Related reading

SOL Weekly Analysis — A 17-Week Doubling Topped Twice at 124.95 / 123.76: The 116.32 Neckline Decides 124.95 or 100.19
SOL doubled 107.8% in 17 weeks into a 124.95 / 123.76 two-touch top and paid its 108.29 count to 105.71. The 116.32 neckline decides 124.95 or 100.19.

AVAX Weekly Analysis — A 55.2% Thrust and Four 2x-Volume Weeks Under a 12.008 Two-Touch Top: The 10.866 Retrace Decides 14.25 or 8.387
AVAX ran a 55.2% week on 2.27x volume, then coiled four weeks under an 11.799 / 12.008 two-touch top. The 10.866 line decides 14.25 or the 8.387 count.

ETH Daily Analysis — A 2,392.96 Count 94% Filled and Five Rising Lows Back at the 0.382: The 2,635 Line Decides 2,777 or 2,406
ETH's 2,807/2,600 distribution left a 2,392.96 count that went 94% filled at 2,406.11. Five rising lows have retaken the 0.382 — 2,635 decides 2,777 or 2,406.