
DOGE Daily Analysis — The 0.0914 Floor Cracked to 0.09031 on 1.14x Volume: The 0.09210 Half-Retrace Decides 0.0998 or 0.0888
Dogecoin flushed through a six-session floor to 0.09031 on 1.14x volume, then closed back at 0.09293. The 0.09210 half-retrace decides 0.0998 or 0.0888.
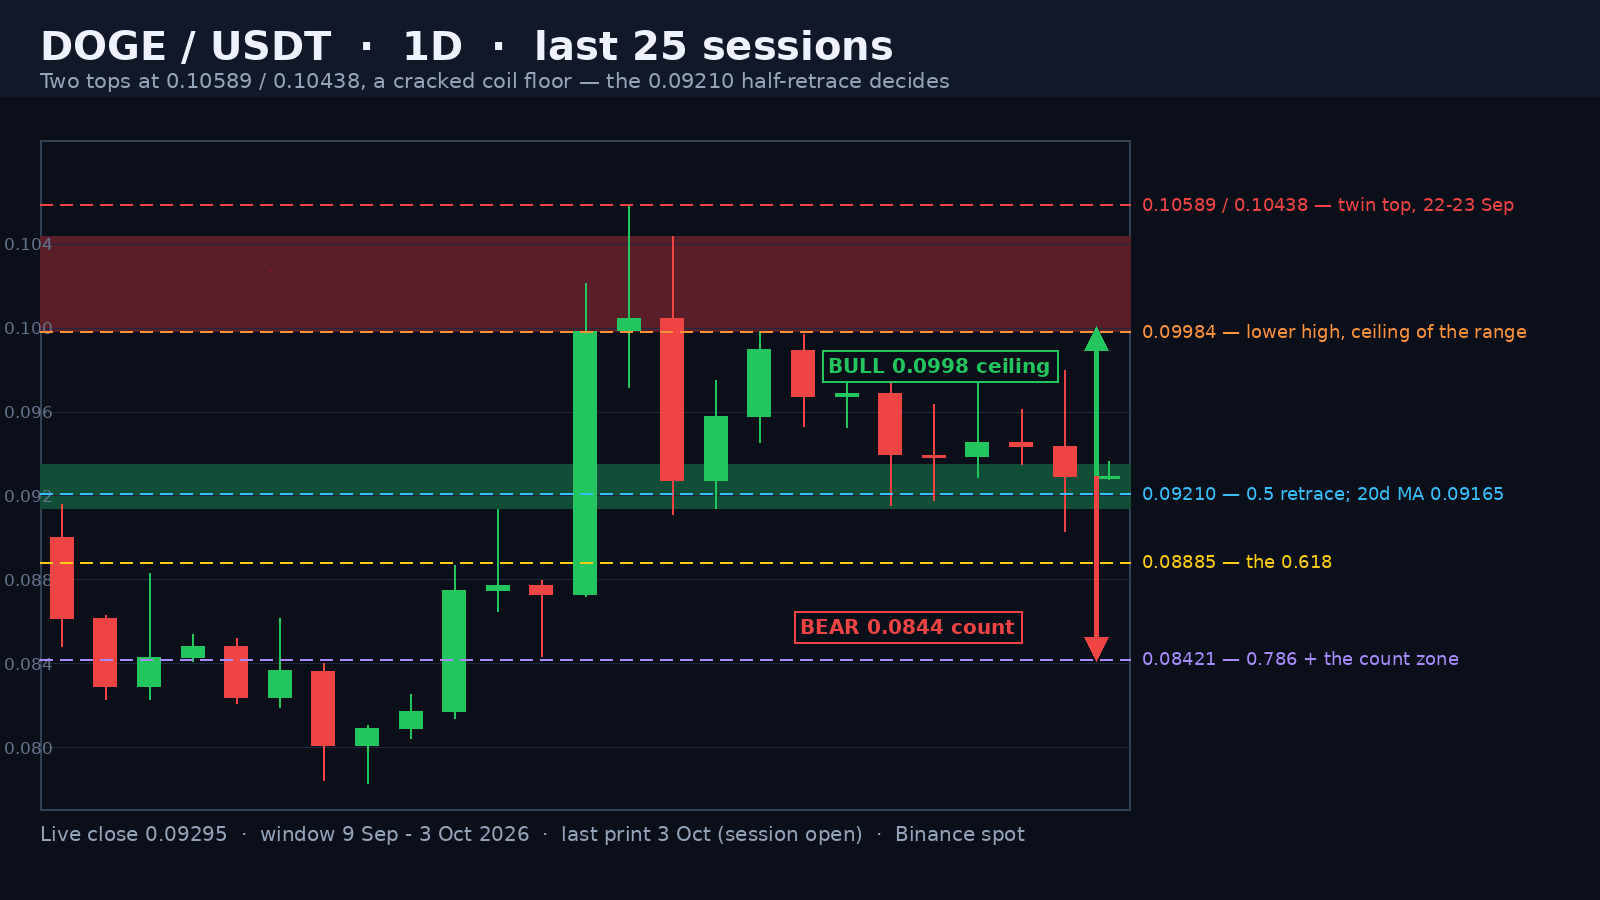
Dogecoin is trading at 0.09292 in the opening hours of the 3 October session, 12.25% under the 0.10589 high it printed on 22 September — the top of the entire four-month window — and 18.7% above the 0.07831 low of 16 September that started the leg. Today's range is 0.00085 points, 0.91% of spot, on a 0.10x full-day volume pace against the 20-day average of 1.03 billion DOGE. The number that matters is 0.09210: the 50% retracement of the 0.07831 - 0.10589 leg sits 0.00085 under the live close, and the 20-day average at 0.09165 sits 0.00130 under it — two independent measures in the same quarter-cent pocket. The 2 October session printed 0.09031, 0.00562 below the close, and the market bought it back the same day.
A 2.48x Top, a 0.10438 Twin and a Ceiling Nobody Has Reclaimed
The 22 September session is where the structure starts. It opened 0.09987, ran to 0.10589 and closed 0.10044 on 2.25 billion DOGE — 2.48x the 20-day average and the heaviest print of the window. One session later the market tagged 0.10438, just 0.00151, or 1.4%, under that high, then closed 0.09272, which is 0.01166 below its own high, on 1.97 billion (2.00x). That rejection, on volume, is what turns a spike into a two-touch top. The pivot low between the two peaks is the 22 September low of 0.09716 — a shallow neckline, which is why the count measured from it is modest: 0.10589 minus 0.09716 is 0.00873, projecting 0.08843. The more useful ceiling came two sessions later: the 25 September high printed 0.09984, and nothing since has touched it — 0.09971, 0.09893, 0.09784, 0.09638, 0.09819, 0.09612 and 0.09796 all died below, seven highs in eight sessions inside a 0.00372 band.
Advertisement
Six Sessions Over a Rising Floor — and the Crack on 2 October
Underneath, the floor was doing the opposite. The 24, 28, 29, 30 September and 1 October lows read 0.09141 / 0.09153 / 0.09178 / 0.09287 / 0.09350 — five rising lows inside 0.00209, about 0.0005 of lift a step, with the 23 September low at 0.09113 as the base of them. A ceiling that will not lift over a floor that keeps lifting is a coil, and the volume behind it was fading: six of the seven sessions from 25 September to 1 October printed 1.04x, 0.51x, 0.71x, 1.13x, 0.68x, 0.87x and 0.54x their 20-day averages. The 2 October session broke it. It opened 0.09436, ran to 0.09796, then sold to 0.09031 — 0.00110 under the lowest of the five higher lows — on 1.13 billion DOGE, 1.14x, before closing 0.09293, which is 0.00262 back off the low. A break that is bought back the same session is a sweep, not a breakdown: the close stayed above the 0.09210 half-retrace and above the 20-day average.
Step Back: a Descending Triangle Under the Two Tops
The wider shape is a descending triangle. The ceiling slopes down from 0.10438 through 0.09984 to 0.09796 while the floor sat flat between 0.09113 and 0.09350. At its widest the height is 0.10438 minus 0.09141, or 0.01297, so a decisive close under the floor projects 0.07844 — but that is the same 0.0783 area the leg started from, and nothing in the last three weeks suggests that distance is available without a bigger catalyst. The nearer measurement is the coil itself: 0.09971 on 26 September to 0.09153 on 28 September is 0.00818, projecting 0.08335, and the 0.786 retracement at 0.08421 sits 0.00086 above it. Read together, the bear zone is 0.0834 - 0.0842, with the 0.618 at 0.08885 as the first real shelf and the 0.08730 open of the 21 September breakout candle sitting between them.
Advertisement
What Each Side Needs
The bull case starts with a daily close above the 0.09210 half-retrace that has now held twice, then a reclaim of the 0.09638 - 0.09796 band that has capped the last four sessions. A close over 0.09984 is the first thing the market has not managed since 25 September; above it the coil's own height projects 0.10802 and the 0.236 retracement at 0.09938 is the level that opens the door. Momentum is neutral rather than stretched — RSI is 53.8 and the 20-day average sits 1.4% under spot — so there is room in both directions.
The bear case needs the close, not the wick. A daily close under 0.09031 confirms the floor break and activates both measurements, 0.08885 then 0.08421, and the 0.08730 shelf sits inside that gap. The 14-day ATR is 0.00526, or 5.66% of spot, so one average session can travel 0.0882 - 0.0941 on its own; that is precisely why the intraday prints are noise here and the daily close is the signal. A close back above 0.09500 cancels the bear read entirely and puts the 0.09984 ceiling back in play.
Written by
EarnCrypto.dev Editorial
The EarnCrypto.dev editorial team researches and reviews AI mining platforms, pools and earning tools — publishing only what passes our own checks.
Related reading

SOL Weekly Analysis — A 17-Week Doubling Topped Twice at 124.95 / 123.76: The 116.32 Neckline Decides 124.95 or 100.19
SOL doubled 107.8% in 17 weeks into a 124.95 / 123.76 two-touch top and paid its 108.29 count to 105.71. The 116.32 neckline decides 124.95 or 100.19.

AVAX Weekly Analysis — A 55.2% Thrust and Four 2x-Volume Weeks Under a 12.008 Two-Touch Top: The 10.866 Retrace Decides 14.25 or 8.387
AVAX ran a 55.2% week on 2.27x volume, then coiled four weeks under an 11.799 / 12.008 two-touch top. The 10.866 line decides 14.25 or the 8.387 count.

ETH Daily Analysis — A 2,392.96 Count 94% Filled and Five Rising Lows Back at the 0.382: The 2,635 Line Decides 2,777 or 2,406
ETH's 2,807/2,600 distribution left a 2,392.96 count that went 94% filled at 2,406.11. Five rising lows have retaken the 0.382 — 2,635 decides 2,777 or 2,406.