
BTC Daily Analysis — A Nine-Touch 79,220–80,684 Shelf Broke on 1.81x Volume: The 80,662 Retest Decides 73,543 or 84,898
Bitcoin lost the 79,220–80,684 shelf on 1.81x volume and closed at 77,991, its lowest since 17 September. The 79,071–80,662 retest now decides 73,543 or 84,898.
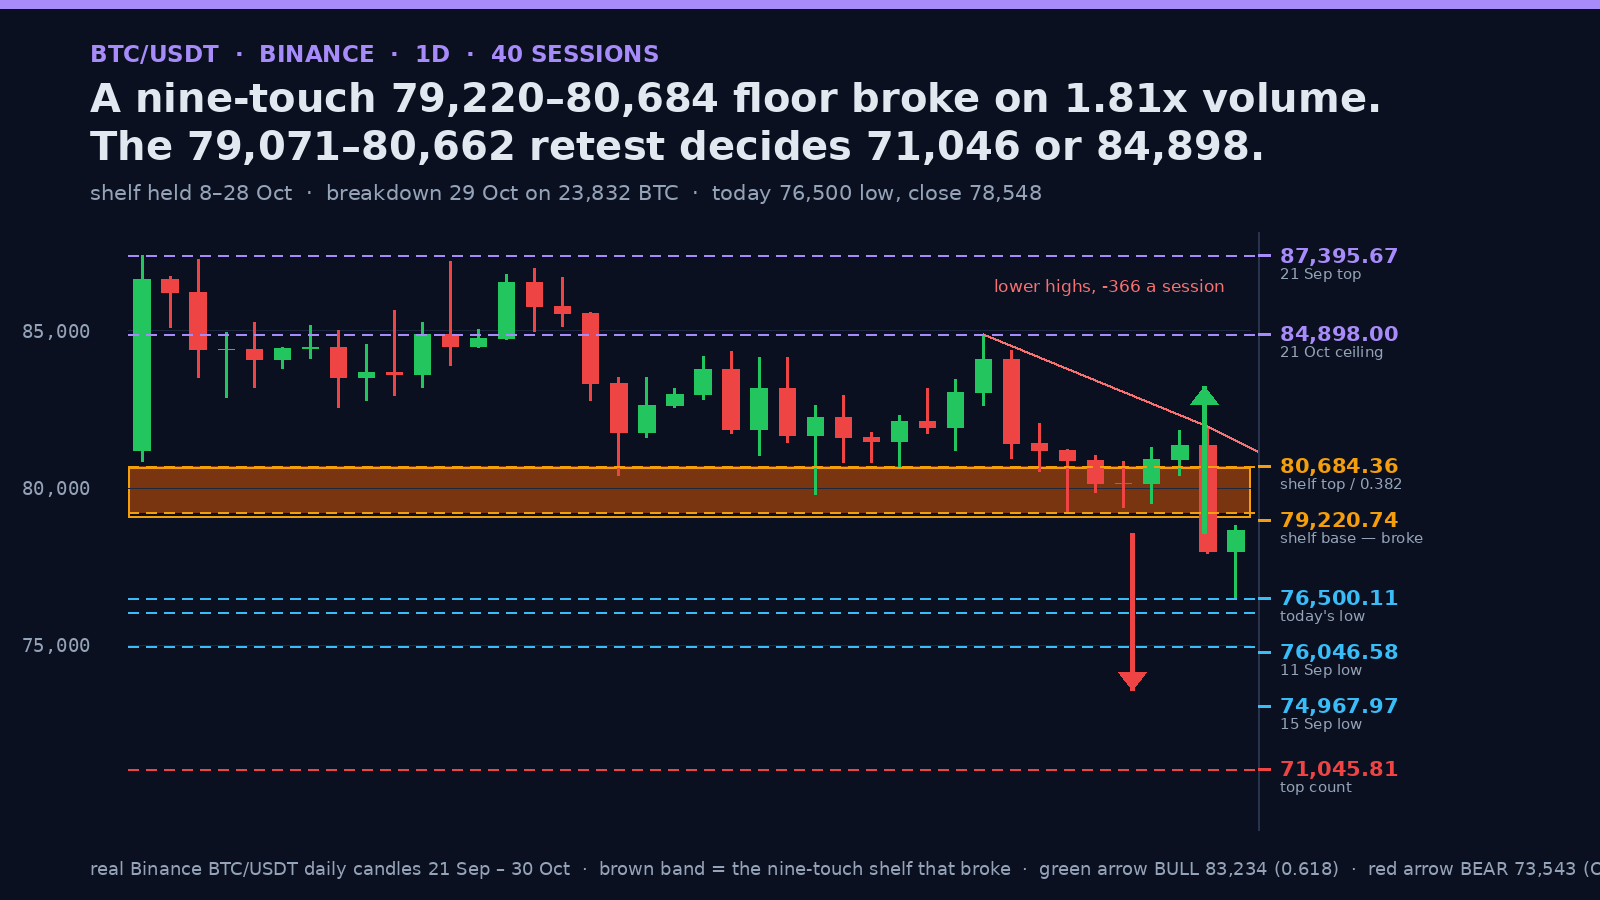
Bitcoin closed at 77,991.89 on 29 October, 4.12% under the previous close and the lowest close since 17 September, then printed 76,500.11 in the session that followed and recovered to 78,548.00. The move that did it was not a wick: 23,832 BTC traded, 1.81x the twenty-day average of 13,711, on a 4.99% range. That is the heaviest session since 2 October, when 26,500 BTC printed at the 87,220 rejection.
The floor that held nine times
The level that broke was not a line, it was a shelf. Between 8 and 28 October every daily low that mattered landed inside 79,220.74–80,684.36, a band 1.85% wide: 80,393.56 on 8 October, 79,800.00 on the 15th, 80,684.36 on the 18th, 80,513.00 on the 23rd, 79,220.74 on the 24th, 79,845.86 on the 25th, 79,368.67 on the 26th, 79,506.00 on the 27th, 80,397.14 on the 28th. Nine lows. Fifteen sessions. Not one close under the base — the weakest close inside the shelf was 80,150.56 on 26 October.
Advertisement
A shelf tested that many times is where sellers were absorbing, and it is also where the buyers' stops were sitting. Both of those things stop working on the same day.
What the breakdown session actually did
29 October opened at 81,343.50, ran to 81,971.00, then gave back 4,061 points to 77,910.00 and closed at 77,991.89. That close is under the shelf base at 79,220.74 and under the 8 October low at 80,393.56 that had been the floor of the entire October range. Volume is what separates a flush from a breakdown, and 23,832 BTC against a 13,711 average is not a wick being shaken out.
Advertisement
The next session undercut again to 76,500.11 before closing 2,048 points higher. That recovery matters for the near-term path and it changes nothing about the structure yet.
The retest band is the whole story
Two measures land on the same strip of price. Take the entire decline from the 21 September top at 87,395.67 to today's 76,500.11: the 0.236 sits at 79,071.46 and the 0.382 at 80,662.21. That band is — within 22 points at the top — the shelf that just broke.
So the old floor is now the first supply. The behaviour in 79,071.46–80,662.21 is the trade: a rejection there is a textbook breakdown retest, and a daily close above 80,662.21 puts the October range back together. Everything between the current price and that band is noise, not signal.
The two counts below
Measured move from the October box: 84,898.00 minus 79,220.74 is 5,677.26, projected under the base that gives 73,543.48. Measured move from the whole top: 87,395.67 minus 79,220.74 is 8,174.93, projected under the base that gives 71,045.81. The first is the conservative objective, the second only becomes live once 73,543.48 goes.
Between the current price and those targets sits the September shelf: 76,046.58 from 11 September and 74,967.97 from 15 September, the lows the run to 87,395.67 left behind and never revisited. Those two prints are the natural places for a first defence.
Why the bounce is not a reversal yet
Today's low at 76,500.11 was bought back 2,048 points, and the close finished 2.67% off that low. That is a real wick, not a drift. Three things are still missing, though.
Price closed 523 points under even the 0.236 at 79,071.46. The last eight sessions have all respected a descending ceiling running from 84,898.00 on 21 October to 81,971.00 on 29 October — a line falling 366 points a session with no high above it since it started; it reads 81,605 for today and today's high of 78,804 stayed 2,801 under it. And a wick that recovers into a broken shelf is a test, not a repair, until the shelf is taken back.
What flips it
A daily close above 80,662.21 — the shelf top and the 0.382 at once — turns the breakdown into a sweep. Above it the ladder is 81,947.89 at the 0.5, then 83,233.57 at the 0.618, then the 84,898.00 ceiling that capped October. A close above 84,898.00 is a different market and kills the count outright.
Underneath, 79,071.46 is the first real decision, 76,500.11 the second, and 76,046.58 the third. A close under 76,046.58 opens 74,967.97 with nothing structural in between, and that is where the 73,543.48 count starts to look like a destination instead of a projection.
The ladder
87,395.67 → 84,898.00 → 83,233.57 → 81,947.89 → 80,684.36 → 79,071.46 → 76,500.11 → 76,046.58 → 74,967.97 → 73,543.48 → 71,045.81.
Path of least resistance stays lower while Bitcoin is under 79,071.46, and the probabilities are 55/45 rather than wider: the shelf broke with real size, but the 2.67% recovery off 76,500.11 says the first attempt to extend has already met buyers. ATR(14) is 1,978 points, 2.52% of spot, so a retest of the band and a rejection from it can both happen inside three sessions.
A shelf that held nine times does not stop mattering when it breaks. It changes sides.
Written by
EarnCrypto.dev Editorial
The EarnCrypto.dev editorial team researches and reviews AI mining platforms, pools and earning tools — publishing only what passes our own checks.
Related reading
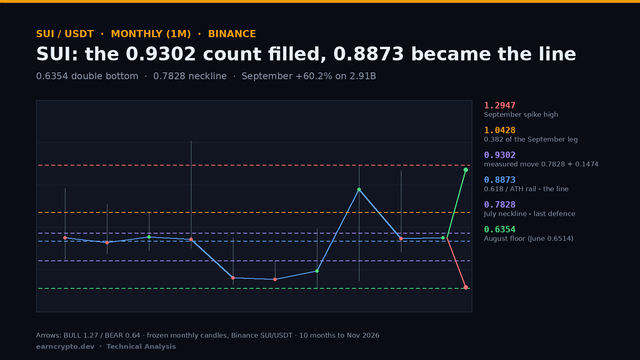
SUI Monthly Analysis — A 0.6354 Double Bottom Filled Its 0.9302 Count: The 0.8873 Retrace Decides 1.0428 or 0.7828
SUI filled the 0.9302 count of its 0.6354 double bottom at September's high and gave 22.8% back in October. The 0.8873 retrace now decides 1.0428 or 0.7828.
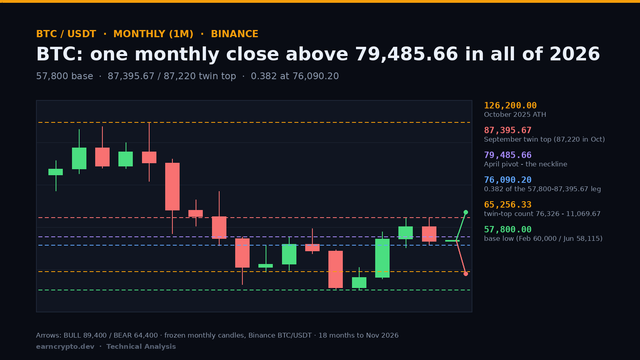
BTC Monthly Analysis — A Single 2026 Close Above 79,485.66 and an 87,395.67 Twin Top: 76,090 Decides 89,400 or 65,256
BTC closed October at 77,582, -7.2% under its open and back below the 79,485.66 pivot. The 76,090.20 retrace now decides whether 89,400 or 65,256 comes first.
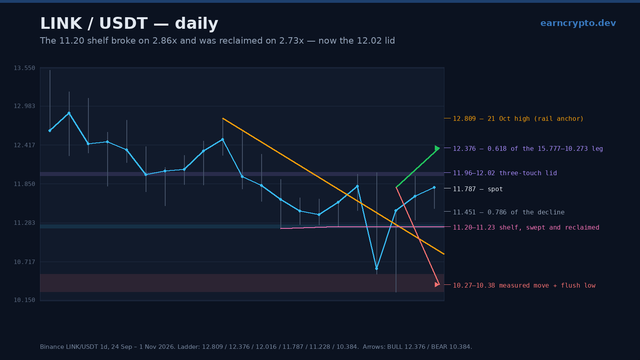
LINK Daily Analysis — The 11.20 Shelf Broke on 2.86x and Was Reclaimed on 2.73x: The 12.02 Lid Decides 12.38 or 10.38
Chainlink swept the 11.20 shelf on 2.86x volume, reversed the whole break on 2.73x and now fights a three-touch 11.96-12.02 lid. 12.02 decides 12.38 or 10.38.