
BTC Daily Analysis — Five Rising Lows Into the 87,395 / 87,278 Twin Top: The 85,114 Neckline Decides 89,677 or 82,563
Bitcoin sits 1.67% under its 87,395.67 twin top after five rising lows, with a live close back over the 85,114 neckline and the count under it at 82,832.
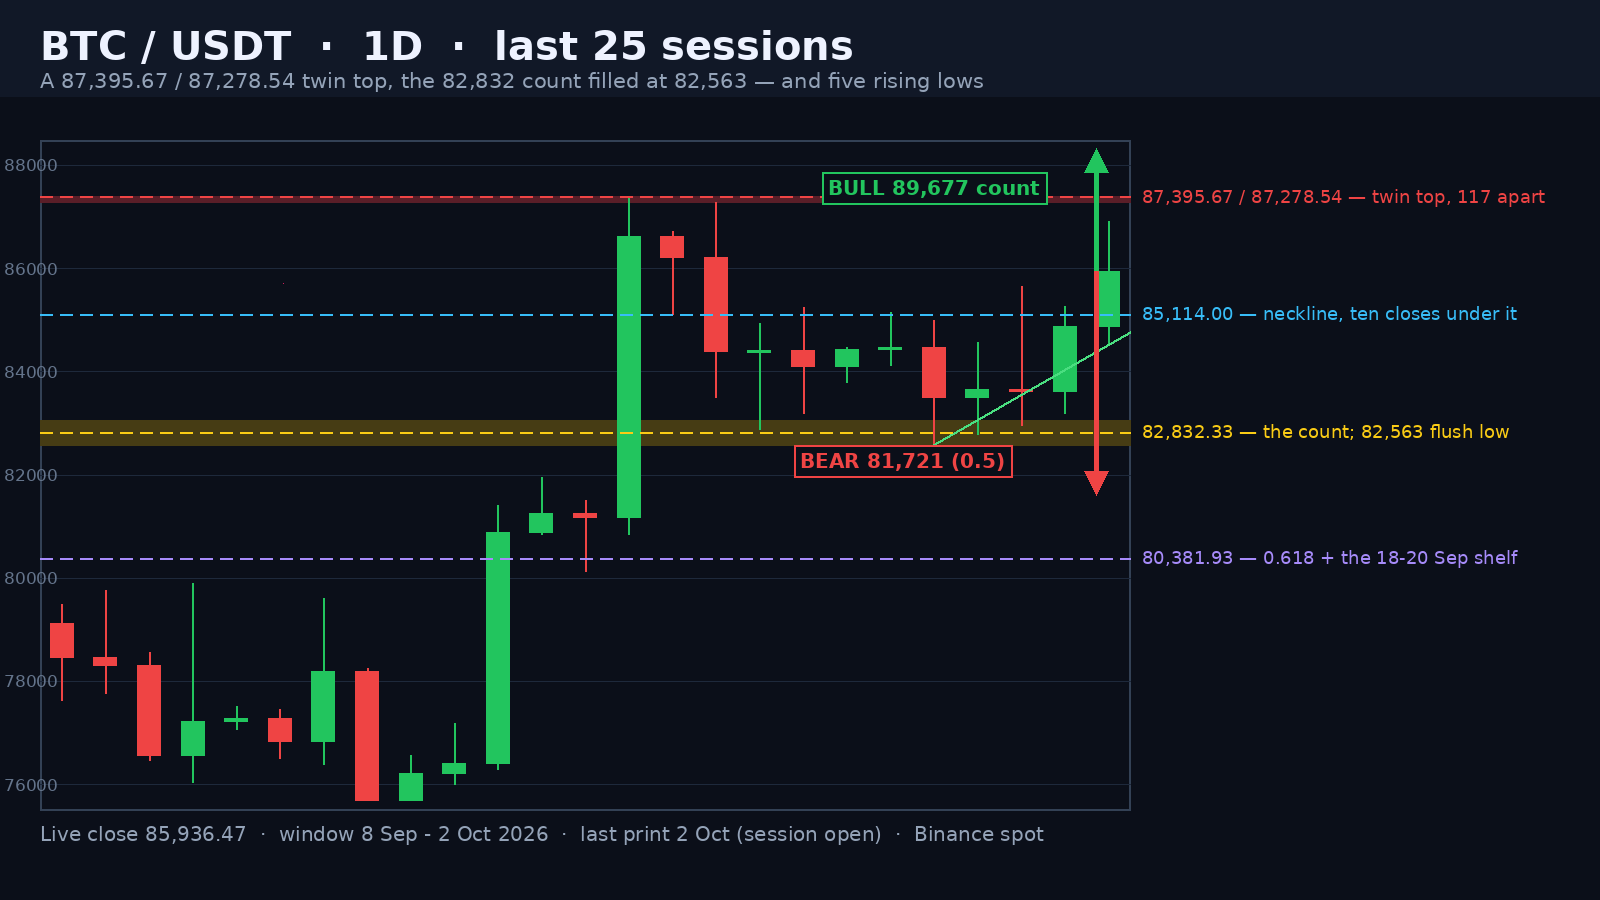
Bitcoin is trading at 85,989.89 in the opening hours of the 2 October session, 1.61% under the 87,395.67 high it printed on 21 September — the top of the entire four-month window — and 13.1% above the 76,046.58 low of 11 September that started the leg. Today's range is 2,392.75 points, 2.78% of spot, on a 0.44x full-day volume pace against the 20-day average of 16,154 BTC. The session has already printed 86,912.75, the third-highest high of the window, and the live close is 875.89 above the 85,114.00 neckline that nine consecutive sessions failed to reclaim.
A 31,963-Bitcoin Top and a 117-Point Twin
The 21 September session is where the structure starts. It opened 81,178.01, dipped to 80,850.22, ran to 87,395.67 and closed 86,620.00 — a 6,545.45-point range — on 31,963 BTC, 2.23x the 20-day average of the time and the heaviest print anywhere in the window. Two sessions later the market tried again: the 23 September high printed 87,278.54, just 117.13 points — 0.13% — under the first peak, and the session then closed 84,397.60, which is 2,880.94 points below its own high. That rejection, on 22,151 BTC (1.42x), is what turns a spike into a two-touch top. The pivot between the two peaks printed 85,114.00 on 22 September, and that is the neckline every level in this article is measured from.
Advertisement
The Count Was Filled at 82,563 — on a Wick, Not a Close
Take the twin top's own arithmetic: 87,395.67 minus the 85,114.00 neckline is 2,281.67 points, and projected down from the neckline that gives 82,832.33. The 28 September session printed a low of 82,563.00 — 269.33 points through the count — and closed at 83,500.01, 667.68 points back above it. Not one of the nine closes since the second top has been under 82,832. Two independent measurements sit in the same pocket: the 0.382 retracement of the 76,046.58 - 87,395.67 leg is 83,060.32, so the count and the retracement bracket an 82,832 - 83,060 band that was tested intraday and bought, twice — 82,563.00 on 28 September and 82,775.94 the session after.
Five Rising Lows and the First Close Back Over 85,114
From that flush low the lows have stepped up every session: 82,563.00 (28 Sep), 82,775.94, 82,956.11, 83,186.00 and 84,520.00 today — five higher lows, 1,957 points of lift. The highs are messier — 84,999.00, 84,563.99, 85,649.95, 85,273.65 and 86,912.75 — which is what a genuine recovery looks like before a breakout. The part that matters is the neckline: the closes from 23 September through 1 October printed 84,397.60 / 84,410.24 / 84,099.99 / 84,433.10 / 84,472.00 / 83,500.01 / 83,663.66 / 83,623.60 / 84,880.05 — nine sessions, every one of them under 85,114.00. Today's live print is the first back above it, and it is doing it on a sub-0.5x volume pace, which is the one caveat. Momentum agrees with the bulls but is stretched: RSI is 70.6, the highest reading of the whole recovery, and the 20-day average sits about 4.7% below spot, so the market is extended above its own mean.
Advertisement
What Each Side Needs
The bull case is a close, not a print. A daily close above 85,114.00 converts today into the reclaim and puts the twin top back in play: the first confirmation is 87,278.54 and the trigger is 87,395.67, above which the double top's own count re-opens upward — 87,395.67 plus 2,281.67 gives 89,677.34. The wider range measure is bigger: 82,563.00 to 87,395.67 is 4,832.67 points, so a confirmed break projects 92,228.34. Note what has to be absorbed first: 87,395.67 is the 120-day high itself, so there is no overhead supply in the window — only the two rejection candles that made the top.
The bear case needs the reclaim to fail. A close back under 85,114.00 re-opens the 82,832 count with the 0.382 at 83,060.32 just above it, so the first support is that 82,832 - 83,060 pocket. Losing the five-session floor at 82,563.00 breaks the rising-low sequence, and the next measurements are the 0.5 at 81,721.12 and then the 0.618 at 80,381.93, which is bracketed by the 18-20 September breakout shelf (80,126.04 and 80,844.58 prints). With a 14-day ATR of 2,260.41 points — 2.63% of spot — one average session can travel a third of the distance between the two triggers, so the daily close is the signal and the intraday print is not.
Written by
EarnCrypto.dev Editorial
The EarnCrypto.dev editorial team researches and reviews AI mining platforms, pools and earning tools — publishing only what passes our own checks.
Related reading

SOL Weekly Analysis — A 17-Week Doubling Topped Twice at 124.95 / 123.76: The 116.32 Neckline Decides 124.95 or 100.19
SOL doubled 107.8% in 17 weeks into a 124.95 / 123.76 two-touch top and paid its 108.29 count to 105.71. The 116.32 neckline decides 124.95 or 100.19.

AVAX Weekly Analysis — A 55.2% Thrust and Four 2x-Volume Weeks Under a 12.008 Two-Touch Top: The 10.866 Retrace Decides 14.25 or 8.387
AVAX ran a 55.2% week on 2.27x volume, then coiled four weeks under an 11.799 / 12.008 two-touch top. The 10.866 line decides 14.25 or the 8.387 count.

ETH Daily Analysis — A 2,392.96 Count 94% Filled and Five Rising Lows Back at the 0.382: The 2,635 Line Decides 2,777 or 2,406
ETH's 2,807/2,600 distribution left a 2,392.96 count that went 94% filled at 2,406.11. Five rising lows have retaken the 0.382 — 2,635 decides 2,777 or 2,406.