
BNB Daily Analysis — Four Sessions in a 3.54-Point Close Band: The 780.64 Retest Decides 858 or 743
BNB broke 780.64 on 21 September, swept to 756.83 — one point over the 0.5 retrace — and has coiled in a 3.54-point band since. The gate decides 858 or 743.
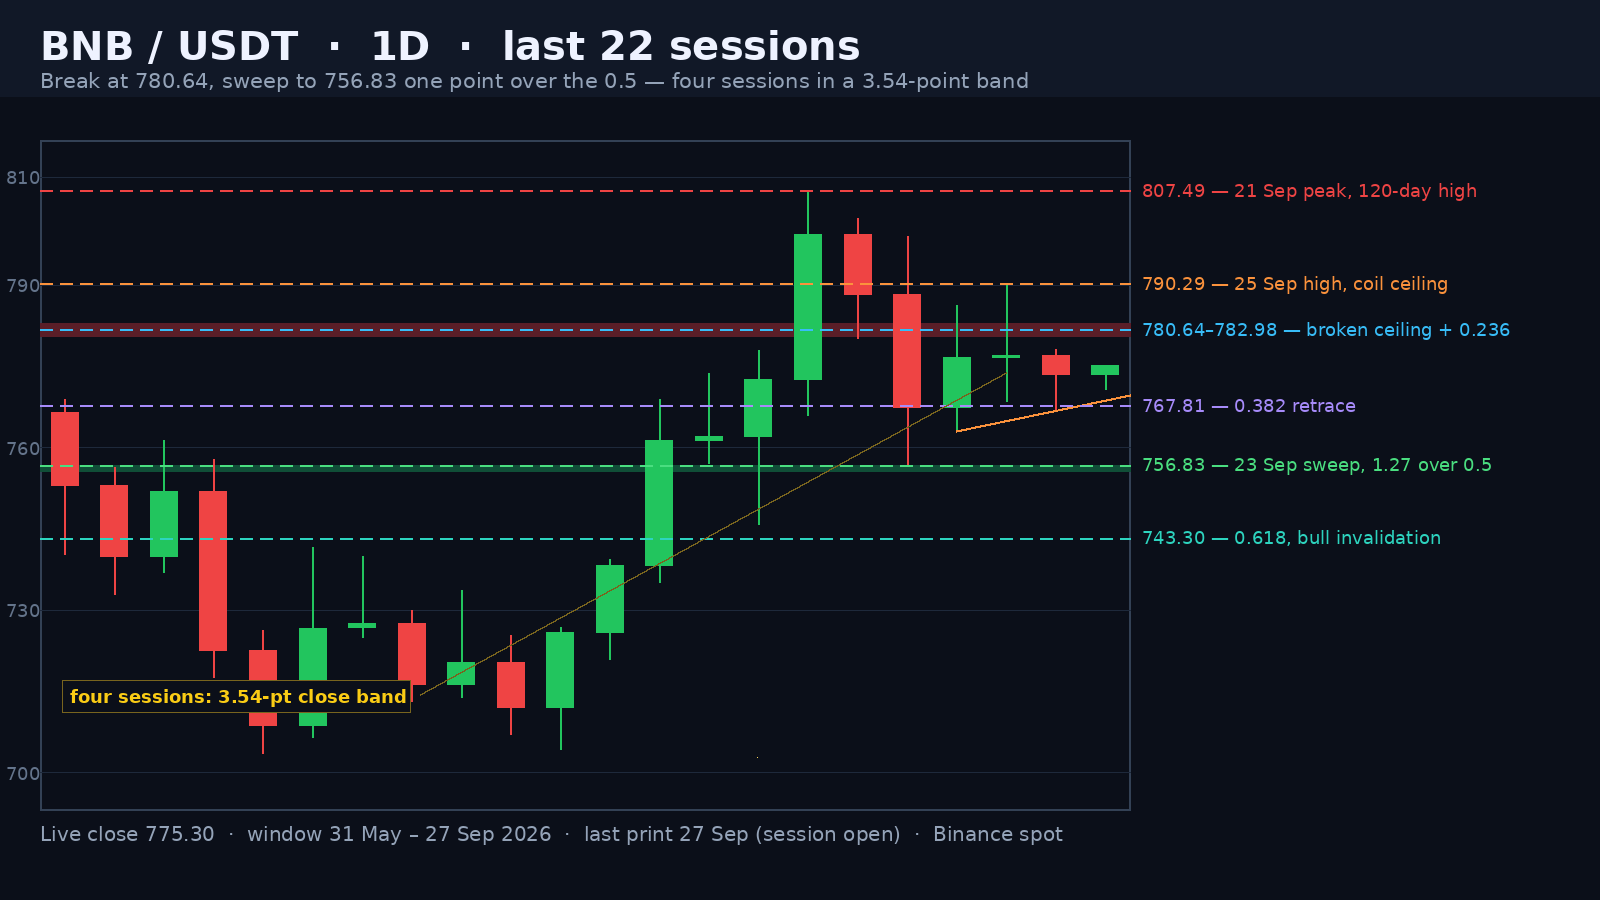
BNB is trading at 775.29 in the opening hours of the 27 September session, 3.99% under the 807.49 peak of 21 September — the highest price since 31 January — and 44.3% above the 1 July window low of 537.25. Today's range is 4.48, or 0.58% of spot, on a 0.10x volume pace against the 20-day average of 149,327 BNB. Five sessions after the breakout, the market is sitting three to seven points underneath the level it broke, and it has stopped moving: the last four closes fit inside 3.54 points.
The Break Was Real: 807.49 on 1.95x Volume
The 21 September session opened 772.56, ran to 807.49 and closed 799.41 on 291,149 BNB — 1.95x the 20-day average and the heaviest print of the last ten sessions. That high is the highest BNB has traded since 31 January 2026, and that close is the highest close since 30 January, when the token closed at 858.81 on its way down to the 1 July low of 537.25. The 5 September ceiling at 780.64 — the level that had capped three weeks of trade, and which this page called the gate on 22 September — did not slow it. Hold on to that 858.81 number; it comes back in the measurements.
Advertisement
The Retest Stopped One Point Above the 0.5
The give-back arrived two sessions later. The 23 September bar opened 788.39, printed 799.00 and 756.83, and closed 767.38 on a 42.17-point range, 5.50% of price — a full session of liquidation that took the market through the 0.382 at 767.81 and closed 0.43 points beneath it. The low is the number that matters. It stopped 1.27 points above the 0.5 retracement of the 703.62–807.49 leg at 755.56, and 1.22 points above the 755.61 ceiling of the 12–17 September coil, which was the last resistance in front of the breakout. Old resistance, retested as support, inside two points. That is a textbook bullish retest, and it has not been violated in the four sessions since.
Four Sessions in a 3.54-Point Close Band
Since the sweep the tape has gone quiet: closes of 776.69, 777.13, 773.59 and 775.29 — a 3.54-point spread, 0.46% of spot, the 6th-tightest four-session close cluster of the 117 windows on this chart. The lows inside it are rising: 763.04, 768.58, 766.82 and 770.85. Every one of those closes is still underneath the 780.64 gate, and only one close since the breakout has printed over the 0.236 at 782.98 — the market is coiling below the level rather than celebrating above it, which is what makes the next close the interesting one. Volume has drained to match: the 26 September session printed 62,074 BNB, the lightest full session of the last twenty-one, and today is running a 0.10x pace.
Advertisement
Where the Measurements Land
Two counts and one historical shelf point at the same place. The September box — floor at 703.62, ceiling at 780.64, a 77.02-point height that the 22 September note measured — projects 857.66 above the break. The full 103.87-point breakout leg, projected from the 756.83 retest low rather than from the breakout itself, gives 860.70. And 858.81 is the 30 January close, the last place BNB traded before the seven-month slide to 537.25. Three references inside three points is closer agreement than measured moves usually manage. The first extension on the way is 835.74, the 1.272 of the leg, and the 1.618 sits at 871.68.
Scenarios and the Invalidation
Above, the gate is 780.64 with the 0.236 two points over it at 782.98. A daily close back above that band puts the 790.29 coil ceiling and the 802.37 / 799.00 prints from 22-23 September in play, and a close over the 807.49 peak opens 835.74 and then the 857.66–860.70 zone. Expect the gate to be poked more than once — the last four sessions have closed within three and a half points of each other, and that kind of compression usually ends with a stop-run rather than a quiet breakout. Below, 763.04 is the first step; a close under it puts the market back at the 756.83 sweep, with the 0.5 at 755.56 and the 0.618 at 743.30 underneath. The bull case dies on a daily close below 755.56 — that would hand back the 755.61 coil ceiling as well and turn the 21 September breakout into a failed one. The bear case dies on a daily close above 807.49.
A breakout on 1.95x volume, a retest that stopped one point above the 0.5, and four sessions in a 3.54-point band underneath the level that was broken — that sequence is what a flag looks like, not what a failure looks like. But the gate has not been reclaimed, and until it is, the burden of proof sits with the bulls.
Two numbers keep this honest. RSI(14) is 61.5, and price sits 3% above the 20-day average at 750.23 and 10% above the 50-day at 701.91, so nothing here is stretched — but the 14-day ATR is 23.26, or 3.0% of spot, which means one ordinary session can travel from 775.29 to either the gate or the 0.5. A coil this tight under a broken ceiling is a decision being made, not a rest.
Watch two lines: 780.64 above, 763.04 below.
Binance BNB/USDT live chartOur 22 September BNB note on the 780.64 break and the 857.66 measured moveBNB market data on CoinGeckoWritten by
EarnCrypto.dev Editorial
The EarnCrypto.dev editorial team researches and reviews AI mining platforms, pools and earning tools — publishing only what passes our own checks.
Related reading

SOL Weekly Analysis — A 17-Week Doubling Topped Twice at 124.95 / 123.76: The 116.32 Neckline Decides 124.95 or 100.19
SOL doubled 107.8% in 17 weeks into a 124.95 / 123.76 two-touch top and paid its 108.29 count to 105.71. The 116.32 neckline decides 124.95 or 100.19.

AVAX Weekly Analysis — A 55.2% Thrust and Four 2x-Volume Weeks Under a 12.008 Two-Touch Top: The 10.866 Retrace Decides 14.25 or 8.387
AVAX ran a 55.2% week on 2.27x volume, then coiled four weeks under an 11.799 / 12.008 two-touch top. The 10.866 line decides 14.25 or the 8.387 count.

ETH Daily Analysis — A 2,392.96 Count 94% Filled and Five Rising Lows Back at the 0.382: The 2,635 Line Decides 2,777 or 2,406
ETH's 2,807/2,600 distribution left a 2,392.96 count that went 94% filled at 2,406.11. Five rising lows have retaken the 0.382 — 2,635 decides 2,777 or 2,406.