
BNB Daily Analysis — A Failed 762.20 Push Hands Back the 0.5: The 750.47 Neckline Decides 770.21 or 690.95
BNB closed above its 750.47 double-top neckline for the first time since 11 October, handed the 0.5 back at 757.92. The neckline now decides 770.21 or 690.95.
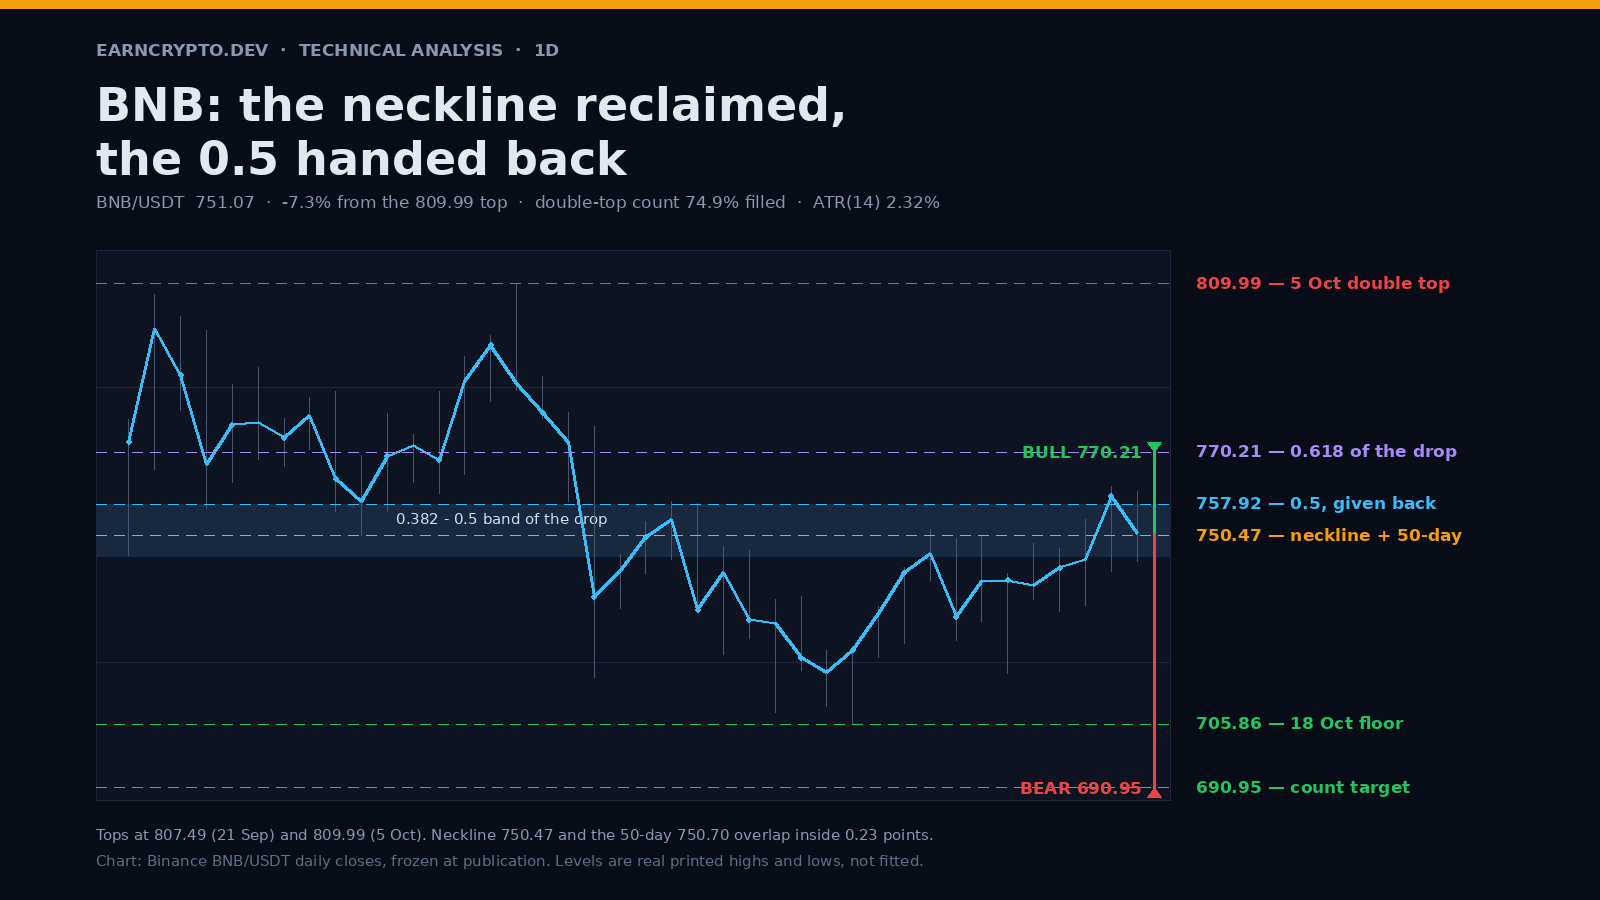
The neckline was reclaimed, the 0.5 was handed back
BNB opened at 759.85 on Wednesday, pushed to 761.00 and then slid to 744.35, closing 751.53 — back under the 0.5 retrace at 757.92, which it had cleared on 28 October for the first time since 7 October. On the 750.47 neckline — the line that matters more — it closed 1.06 points above it. Seven hours of trade have printed 72,769 BNB against a 98,345 twenty-day average — a 2.5x pace, so this rejection carries participation.
Two sessions is not a trend, and one close above a level is not a reclaim. But the recovery has now produced two closes above the neckline — 759.85 on 28 October and 751.53 today — with four higher daily lows behind them, and that combination has not existed since the double top formed.
Advertisement
The double top has filled 74.9% of its count
The pattern is a genuine double top: 807.49 on 21 September and 809.99 on 5 October, 2.50 points apart and fourteen sessions separated. The neckline is the 29 September low at 750.47, which makes the count 59.52 points and projects 690.95. The 8 October session did the damage — open 772.45, high 776.23, low 717.07, close 736.08 on 190,164 BNB, 1.42x its trailing twenty-day average — and the 18 October low at 705.86 filled 74.9% of that count before the market turned.
That unfilled 25.1% is the whole bull argument. A measured move that stops three quarters of the way is a move that ran into demand, and the level it stopped at — 705.86 — is now the line a bear case has to break before the 690.95 projection means anything again.
Advertisement
Four higher lows off the 732.45
Since 26 October every session has bottomed above the last: 732.45, 734.09, 742.00 and today's 744.35. That is four consecutive higher lows, and it has carried the close above the 20-day at 738.55 — 1.76% above it — for a fourth straight session. The 21 October lower high at 751.86, the last cap of the October slide, was cleared by the 28 October print at 762.20.
The most useful confluence on this chart is not a fibonacci level: the 50-day sits at 750.71, 0.24 points above the 750.47 neckline. Price has closed above both in the last two sessions. When a moving average and a pattern neckline overlap inside a quarter of a point, the market is not making two decisions, it is making one — and it has made it twice now, by 9.38 points on 28 October and by 1.06 today. The second margin is the honest one: a close 1.06 above a shelf is a hold, not a breakout.
Where the recovery stopped
Measured against the 5 October to 18 October drop — 104.13 points — today's close sits at a 43.9% retrace and the 28 October high at 762.20 reached 54.1%. The next rungs are 770.21 (0.618) and 787.71 (0.786), and above them the 807.49 top itself. The falling-highs rail from 809.99 to 762.20 declines 2.08 points a session and reads 760.12 for today; today's 761.00 poked 0.88 through it and closed 8.59 back underneath. A poke that fails is not a breakout, but it does tell you where the sellers are sitting.
Below, the map is arithmetic. 745.64 is the 0.382 of the drop, 730.43 is the 0.236, 718.00 is the 24 October low, and 705.86 is the October floor. Lose 750.47 on a close and the base built since 18 October is a bear flag instead — the same neckline that was resistance from 8 to 27 October becomes the trigger for the remaining 59.52 points of the count.
The two paths from 752
Bull: hold the neckline. A close above 757.92 and the market is straight back into the 770.21 test that today interrupted, with 762.20 as the first resistance and 787.71 above it. The realistic shape is not a vertical: a dip to 750.47, a bounce, a second test of 757.92, and a close over it later in the week is how a base gets confirmed. Invalidation is a daily close under 750.47 while the higher lows are intact.
Bear: 750.47 is the whole trade. Under it, 745.64 is the first stop, 730.43 the second, and a close under 718.00 reopens 705.86 with the 690.95 count behind it. Momentum does not argue for that yet — RSI(14) at 61.6 is neutral, not overbought, and the 14-day ATR of 17.45 points (2.32% of spot) is small enough that a single session cannot cover the distance to 718.
The neckline and the 0.5 sit 7.45 points apart, and the market has spent two sessions arguing about which side of both it wants to be on. Until one of them closes decisively, this is a base under construction, not a confirmed one.
BNB is quoted here from Binance BNB/USDT, with market context on CoinGecko and the same daily candles on TradingView. Levels are real printed highs and lows; the scenarios are projections, not forecasts.
Written by
EarnCrypto.dev Editorial
The EarnCrypto.dev editorial team researches and reviews AI mining platforms, pools and earning tools — publishing only what passes our own checks.
Related reading
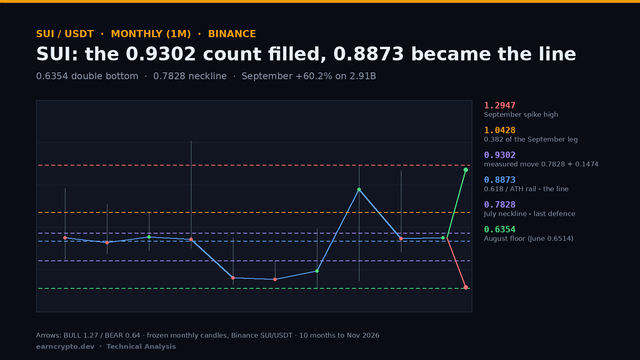
SUI Monthly Analysis — A 0.6354 Double Bottom Filled Its 0.9302 Count: The 0.8873 Retrace Decides 1.0428 or 0.7828
SUI filled the 0.9302 count of its 0.6354 double bottom at September's high and gave 22.8% back in October. The 0.8873 retrace now decides 1.0428 or 0.7828.
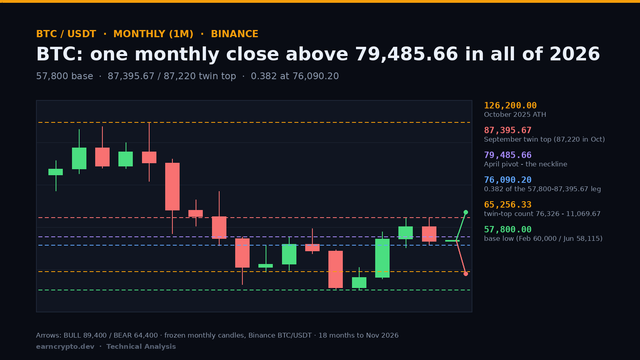
BTC Monthly Analysis — A Single 2026 Close Above 79,485.66 and an 87,395.67 Twin Top: 76,090 Decides 89,400 or 65,256
BTC closed October at 77,582, -7.2% under its open and back below the 79,485.66 pivot. The 76,090.20 retrace now decides whether 89,400 or 65,256 comes first.
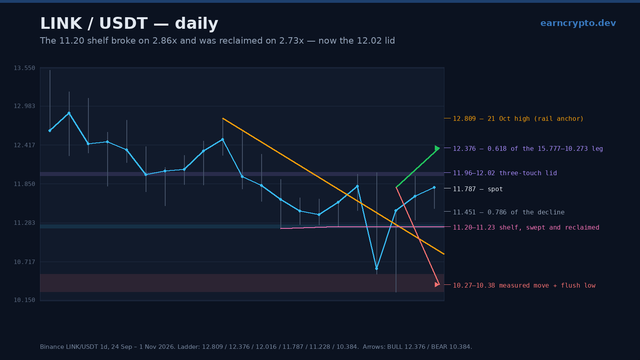
LINK Daily Analysis — The 11.20 Shelf Broke on 2.86x and Was Reclaimed on 2.73x: The 12.02 Lid Decides 12.38 or 10.38
Chainlink swept the 11.20 shelf on 2.86x volume, reversed the whole break on 2.73x and now fights a three-touch 11.96-12.02 lid. 12.02 decides 12.38 or 10.38.