
BNB Daily Analysis — Descending Triangle at $703.62: Eight Lower Highs Decide 741 or 626
BNB has printed eight lower highs under 780.64 while a flat 703.62-708.28 floor held four times — a close over 728 targets 741.61, a break of 703 opens 626.60.
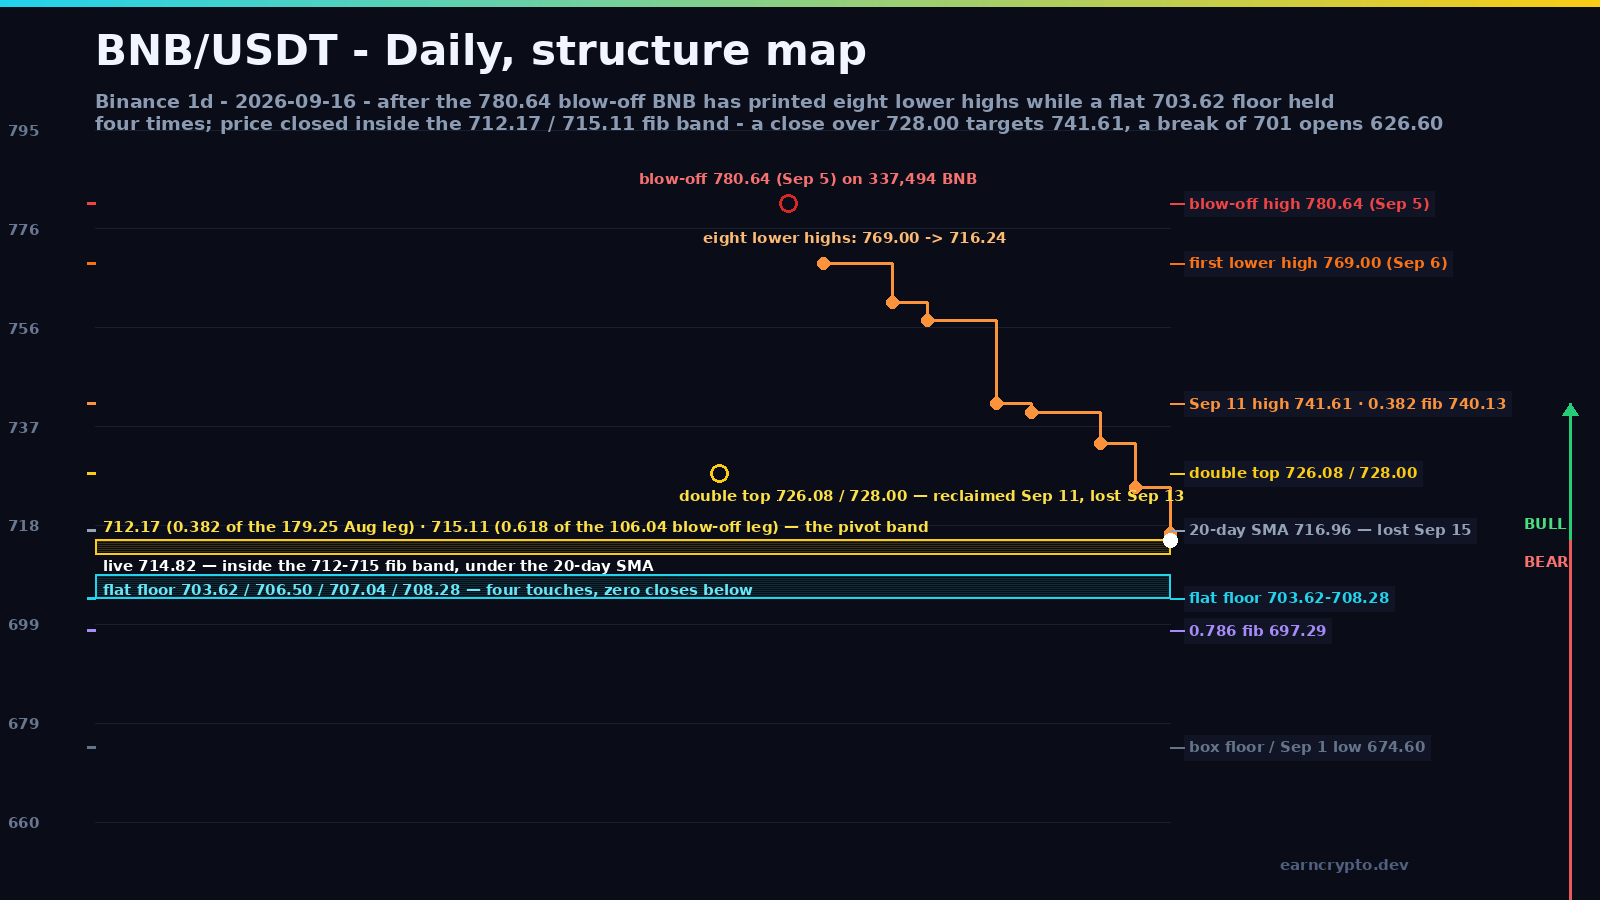
BNB closed Tuesday at 712.06 and is trading at 714.15 now — -1.2% over seven sessions, +17.9% over thirty and -8.5% from the September 5 high of 780.64. Today's range is 716.24 to 708.28 on 25,847 BNB, a 0.18x pace against the 20-day average of 140,453. Eleven sessions after the heaviest print since August 22, that is a market holding its breath rather than leaving.
What the tape has built since is unusually tidy: a staircase of lower highs against a floor that has not moved. The swing highs are 769.00 on September 6, 761.39 on September 8, 757.78 on September 9, 741.61 on September 11, 739.89 on September 12, 733.75 on September 14, 725.32 on September 15 and 716.24 today — eight of them, each below the one before. Only one session in the run, September 13's 729.92, printed a high above the previous day's, and it was still 9.97 points under the September 12 high. The floor is 703.62 on September 10, 706.50 on September 11, 707.04 on September 15 and 708.28 today — four touches inside 4.66 points, not one daily close beneath 703.
Advertisement
A descending triangle on a floor that keeps getting defended
Falling highs plus flat support is a descending triangle, and the textbook resolution is a break of that support. Two things argue for patience before selling it. The first is the volume: today's tape is running at a 0.18x pace against the 20-day average of 140,453 BNB, so sellers are not pressing and buyers are not paying. The second is the floor itself — a level touched four times inside five dollars and never closed below is a level someone is buying, not one that is quietly eroding.
The older references still frame the downside. The 674.60-728.00 box held for eleven sessions before the blow-off, and 674.60 is the September 1 low that started it. Above the current price, 725.32 and the 726.08/728.00 double top are the two levels that separate a pause from a reversal.
Advertisement
712-715 is not a random place to be sitting
The blow-off leg ran from 674.60 to 780.64 — 106.04 points — and its 0.618 retracement sits at 715.11. The wider August leg ran from 601.39 to 780.64 — 179.25 points — and its 0.382 sits at 712.17. Two independent measurements 2.94 points apart, and today's close printed inside them. That confluence is why the last three sessions have done nothing: price is standing exactly where the two most-watched retracements of the rally meet.
Above the band the levels stack quickly: today's high at 716.24, the 20-day SMA at 716.95 — which price has not closed above since September 14 — then 725.32, the 726.08/728.00 double top, and 733.75. The 50-day SMA is far below at 661.37, so the trend is not the argument here; the pattern is. BNB has also lost less than the market it tracks: -1.2% over seven sessions against Bitcoin's -2.9%, and the same 703 floor has been defended through both.
The count if 703.62 goes
Two measures project into the same neighbourhood. The triangle's own height, 780.64 minus 703.62, is 77.02 points, and measured from the floor that is 626.60. The older box, 674.60 to 728.00, is 53.40 points, and projected from its base that is 621.20. Both land in 621-627, which is precisely the August 19-20 breakout base — the 601.39-to-654.80 launch pad the entire rally started from — and independent commentary has been citing 680-690 and then 612-625 as the deeper zones, the same map read from price alone.
BULL case: a close over 728 cancels the triangle
A daily close back above the 20-day SMA at 716.95 would be the first mechanical change in three weeks: it ends the sequence of lower closes and puts 725.32 back in play. Above that, a close over the 726.08/728.00 double top cancels the pattern rather than resolving it, and the next objectives are the September 12 high at 739.89, the 0.382 fib at 740.13 and the September 11 high at 741.61. The bull case dies on a daily close under 701.05, the lower lip of the floor — and it would die quickly, because the floor's four touches are packed into five dollars with no room for a slow failure.
The bear case does not need a crash, it needs one close. Under 703.62, the first shelf is the 0.786 at 697.29, then the half-way mark of the wider August leg at 691.02, then the box base at 674.60. A decisive close under 674.60 opens the 621-627 count, with the rising 50-day average as the first place to expect a genuine bid — that average has not been given a chance to act as support since the August 19 breakout.
A floor defended four times on collapsing volume is not distribution yet, and eight lower highs are not accumulation either. Whichever side of 703.62 the first daily close lands decides the next 77 points — I would rather trade the close than guess the side.
RSI(14) is 54.0, ATR(14) is 22.46 dollars or 3.14% of spot, and the daily ranges have contracted from 2.76% to 2.57% and 1.11% today. Everything about this setup is compression: the extremes of the last eight sessions have narrowed rather than expanded, and compression resolves in a direction. The first daily close outside 703.62-716.95 will say which one.
The event risk is real, the levels are fixed
The FOMC decision lands today, with the funds rate at 3.50-3.75% and futures close to a coin flip between a hold and the first 25bp hike since 2023, followed by the Senate's CLARITY Act procedural vote. BNB has no protocol-specific catalyst of its own this week, which is exactly why the levels matter more than the narrative: the triangle resolves on a close, and the calendar only decides how fast it gets there.
Levels and live candles: BNB/USDT on Binance · BNB on CoinGecko · BNB/USDT chart on TradingView · the September 12 setup: the 780 blow-off and the 703 floor · the week's two votes: 60 votes and the Fed
Written by
EarnCrypto.dev Editorial
The EarnCrypto.dev editorial team researches and reviews AI mining platforms, pools and earning tools — publishing only what passes our own checks.
Related reading

SOL Daily Analysis — Three Touches Under the $120.00 Round Number: The 114.29 Retrace Decides 126.56 or 105.05
Solana has been rejected at the $120.00 round number three sessions in a row after a 25% week. The $114.29 retrace decides whether 126.56 or 105.05 comes next.

BTC Daily Analysis — The 82,300 Box Broke: The 87,396 Double Touch Decides 90,776 or 82,648
Bitcoin broke its five-week $82,300 box on 21 September and has coiled under $87,396 since. The $84,463 retrace decides whether 90,776 or 82,648 comes next.

BNB Daily Analysis — The $780.64 Ceiling Broke: The 782.98 Retrace Decides 858 or 741
BNB cleared the $780.64 ceiling that had held since September 5 and reversed to 782.75 today, two ticks off the 782.98 retracement. The measured move is 858.