
BNB Daily Analysis — Blow-Off at $780 and the Reclaimed $728 Top: The $703 Floor Decides 769 or 674
BNB daily technical analysis: the $780.64 spike filled the 674-728 box measured move, four lower highs followed — hold the $703 floor for 769, lose it for 626.
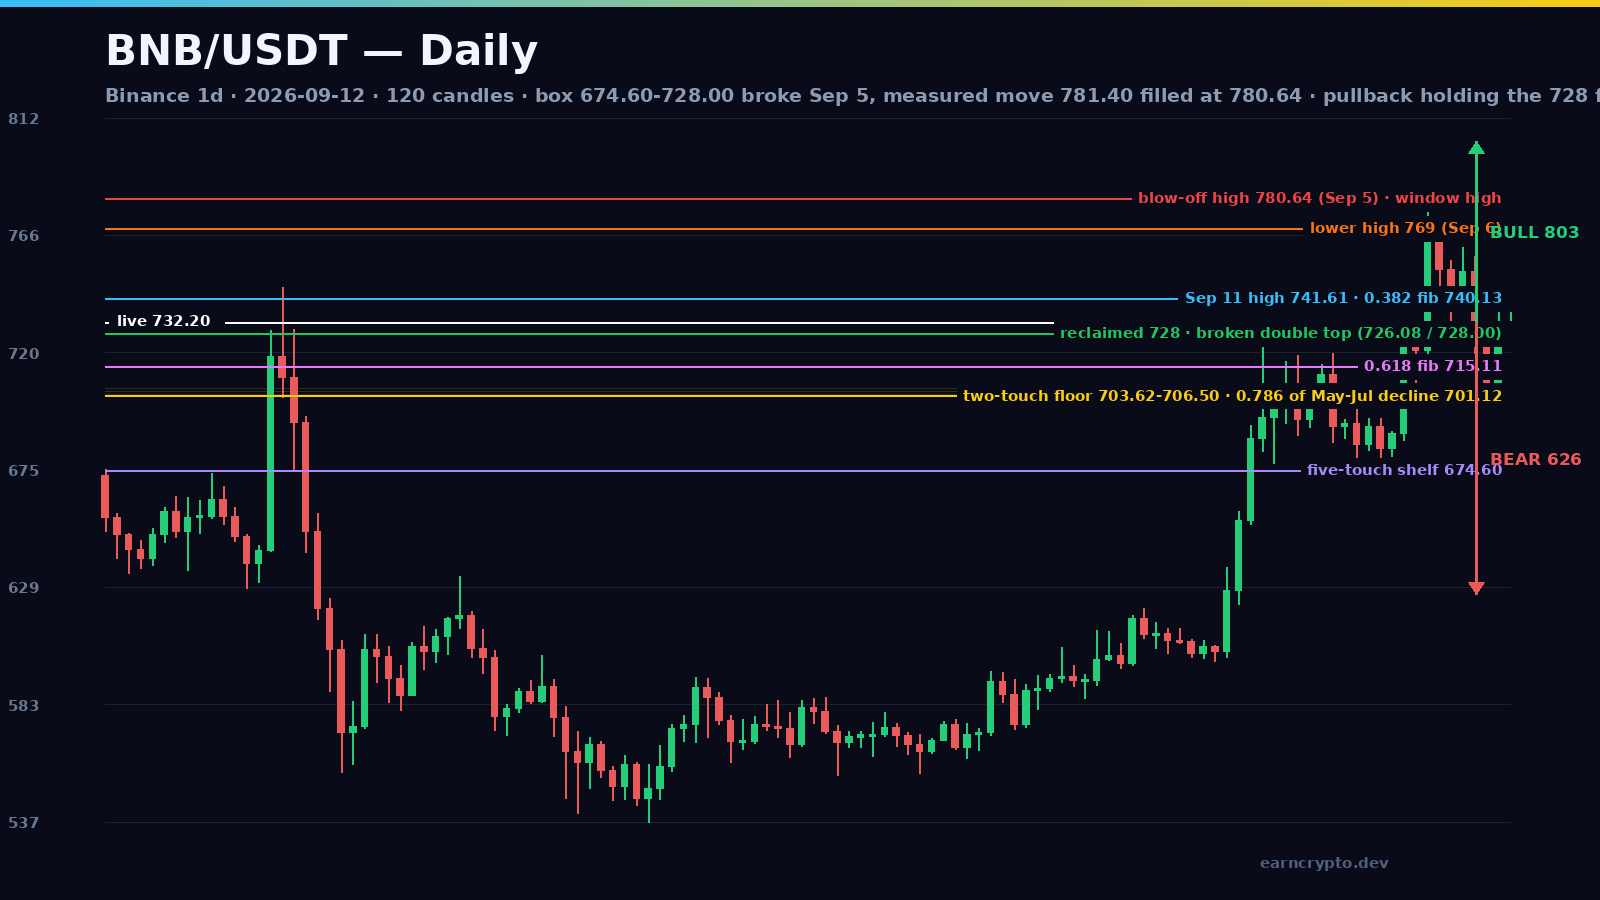
BNB printed the highest price of its 120-session window on September 5 — $780.64 — and has spent every session since handing part of it back. Today it closed at $732.09, back above the $728 ceiling it broke on that spike, with the 0.618 retracement of the move sitting underneath at $715.11. The last four sessions built a descending sequence of highs and a two-touch floor at $703.62. This is a market deciding whether September 5 was a breakout or an exhaustion print, and the answer is being written between $703 and $741.
The 674-728 box, and the spike that filled its target to the tick
The 120-candle window on Binance opens on May 16 with BNB at $672.37, and the tape since then is a lesson in how fast this asset can move in both directions. May 30-31 spiked to $745.74 on 380,166 BNB, and by July 1 the price had collapsed to $537.25 — the window low, on 162,073 BNB, roughly 28% below the May high. From there the repair job was slow: seven weeks of grinding from $537 to the $600-627 area on volumes that mostly stayed under 150,000 BNB a day.
Advertisement
Then came August 19-22. Four sessions took BNB from a $603.95 open to a $726.08 high: a close at $627.51 on 226,890 BNB, then $654.80, then $687.00, then a $726.08 spike on 404,464 BNB — the heaviest candle of the August advance. Eleven sessions of consolidation followed between a ceiling at $726.08 (August 22) and $728.00 (September 3), and a floor built by five separate sessions: $685.39 (August 28), $679.09 (August 30), $682.29 (August 31), $674.60 (September 1) and $679.74 (September 2). That box measured 53.40 points.
September 3 tagged $728.00, and September 5 resolved it: BNB opened at $721.38, ran to $780.64 and closed at $766.53 on 337,494 BNB, 2.4x the 20-day average and the heaviest session since August 22. The box measured move is 728.00 + 53.40 = $781.40. The high was $780.64. The spike delivered the objective to within 76 cents and then stopped — which is the single most useful fact on this chart, because a breakout that fills its measured move on the first thrust is usually a breakout being traded rather than a trend being started.
Advertisement
Four lower highs and a two-touch floor
Since the spike the highs have stepped down in an orderly line: $769.00 (September 6), $761.39 (September 8), $757.78 (September 9) and $741.61 (September 11). Four touches on one descending rail. The lows ran in parallel — $740.24, $733.00, $737.01, $717.61 — until September 10 printed $703.62 on 176,573 BNB and September 11 wicked to $706.50 and closed at $726.75. Two touches of the same floor, both bought back, and not one daily close under $708.72.
The retracement math frames the whole pullback. The spike leg measured $674.60 (September 1 low) to $780.64 = 106.04 points, which puts the 0.382 at $740.13, the 0.5 at $727.62, the 0.618 at $715.11 and the 0.786 at $697.29. Today's close of $732.09 sits between the 0.382 and the 0.5, and the two-touch floor sits just above the 0.786. Underneath that, the 0.786 retracement of the entire May 31-July 1 decline ($745.74 to $537.25) lands at $701.12 — one point under the September 10 low. Three independent measurements put hard support in a five-point band: 701 to 706.
Why 728 is the level that decides the tape
The $726.08/$728.00 pair capped this market for eleven sessions, and when September 5 broke it the breakout was not accepted — September 9 and 10 closed back underneath at $722.64 and $708.72. That is the classic failed-breakout shape, and the only thing that separates a failure from a retest is what happens next. September 11 closed at $726.75, today closed at $732.09, and today's low of $726.10 is the third touch of 726-728 from above, this time holding. Old resistance, new floor — and it is the level every other calculation in this article pivots on.
Bull path: 741, the 760-769 band, then the $780.64 retest
The first confirmation is a daily close above $741.61, September 11's high, which doubles as the 0.382 fib at $740.13. Above it the ladder is $757.78-$761.39 (the September 8-9 highs) and $769.00 (September 6's high). Note what sits inside that band: the 1.272 extension of the August 19-22 impulse ($601.39 to $726.08) lands exactly at $760.00, so the market has already failed twice where the extension says it should fail. A daily close above $769.00 breaks the four-touch lower-high rail; the next gate is the $780.64 window high, and a confirmed close above it projects the 1.618 extension of that impulse at $803.14 — the first real objective above the spike.
Expect that path to be worked, not sprinted. The $741.61 high was already sold once on September 11's wick, so a second attempt should be preceded by a wick back toward $726-728 to re-test the flip, and $757-761 should cap the first push even in the bullish case. The ATR(14) is $24.54, or 3.4% of spot: a completely normal day spans $707-$757 without a single thing changing.
Bear path: 703.62, the five-touch shelf, and 626
The bear case starts with a daily close below $703.62. That breaks the two-touch floor and the $701.12 confluence behind it, puts the 0.786 of the spike leg ($697.29) in play immediately, and opens the August 28-31 lows at $685.39-$682.29 before the market has to deal with the shelf it launched from — the five-touch $674.60-685.39 base.
Below the shelf the arithmetic turns aggressive. The box that broke on September 5 measured 53.40 points; a close back under its floor projects $621.20. The post-spike range from $780.64 to $703.62 measures 77.02 points; the same measurement taken below the floor gives $626.60. Two independent counts land in the $621-627 zone, which is also the August 19-20 base the entire rally started from — the August 19 session that closed at $627.51. Bears need that daily close below $703.62 first: it is a 3.9% move and the whole structure depends on it.
Probabilities and the level sheet
The lean is modestly bullish — roughly 55/45 that $741.61 is traded before $703.62 — but only while the flip holds on a closing basis. RSI(14) at 59.8 is neutral, price is 2.4% above its 20-day average at $714.93 and 12.7% above the 50-day at $649.83, and BNB is +19.8% over thirty days against -4.5% over seven: a market digesting a fast move, not reversing one. The structural argument for the bulls is simpler than any indicator: $780.64 is the highest print of the 120-session window, so there is no overhead supply from this chart above it — the only sellers are the people who bought the spike itself.
Support: $726.10 (today's low, the flip), $715.11 (0.618 fib), $706.50-$703.62 (two-touch floor), $701.12 (0.786 of the May-July decline), $697.29 (0.786 of the spike leg), $685.39-$682.29 (August 28-31 lows), $674.60 (five-touch shelf). Resistance: $741.61 (September 11 high, with the 0.382 at $740.13), $757.78-$761.39, $769.00, $780.64 (window high), $803.14 (1.618 extension). Invalidations: the bull case dies on a daily close below $703.62; the bear case dies on a daily close above $769.00.
Watch the live order flow on Binance, the latest market data on CoinGecko, and the full interactive chart on TradingView.
BNB did the work in one candle — $674.60 to $780.64 in four sessions, a measured move filled to the tick — and has spent a week handing back a third of it. The $703.62 floor and the 0.618 at $715.11 are where buyers have to prove the breakout was real.
Written by
EarnCrypto.dev Editorial
The EarnCrypto.dev editorial team researches and reviews AI mining platforms, pools and earning tools — publishing only what passes our own checks.
Related reading

SOL Daily Analysis — Three Touches Under the $120.00 Round Number: The 114.29 Retrace Decides 126.56 or 105.05
Solana has been rejected at the $120.00 round number three sessions in a row after a 25% week. The $114.29 retrace decides whether 126.56 or 105.05 comes next.

BTC Daily Analysis — The 82,300 Box Broke: The 87,396 Double Touch Decides 90,776 or 82,648
Bitcoin broke its five-week $82,300 box on 21 September and has coiled under $87,396 since. The $84,463 retrace decides whether 90,776 or 82,648 comes next.

BNB Daily Analysis — The $780.64 Ceiling Broke: The 782.98 Retrace Decides 858 or 741
BNB cleared the $780.64 ceiling that had held since September 5 and reversed to 782.75 today, two ticks off the 782.98 retracement. The measured move is 858.