
Bitcoin Just Closed Its Worst October Since 2017 — 0 of 19 Majors Finished Green, and 76,325.98 Decides November
Bitcoin closed October at $77,582, down 7.22% — its worst October on Binance. Zero of 19 majors closed green, and both prior red Octobers led to a red November.
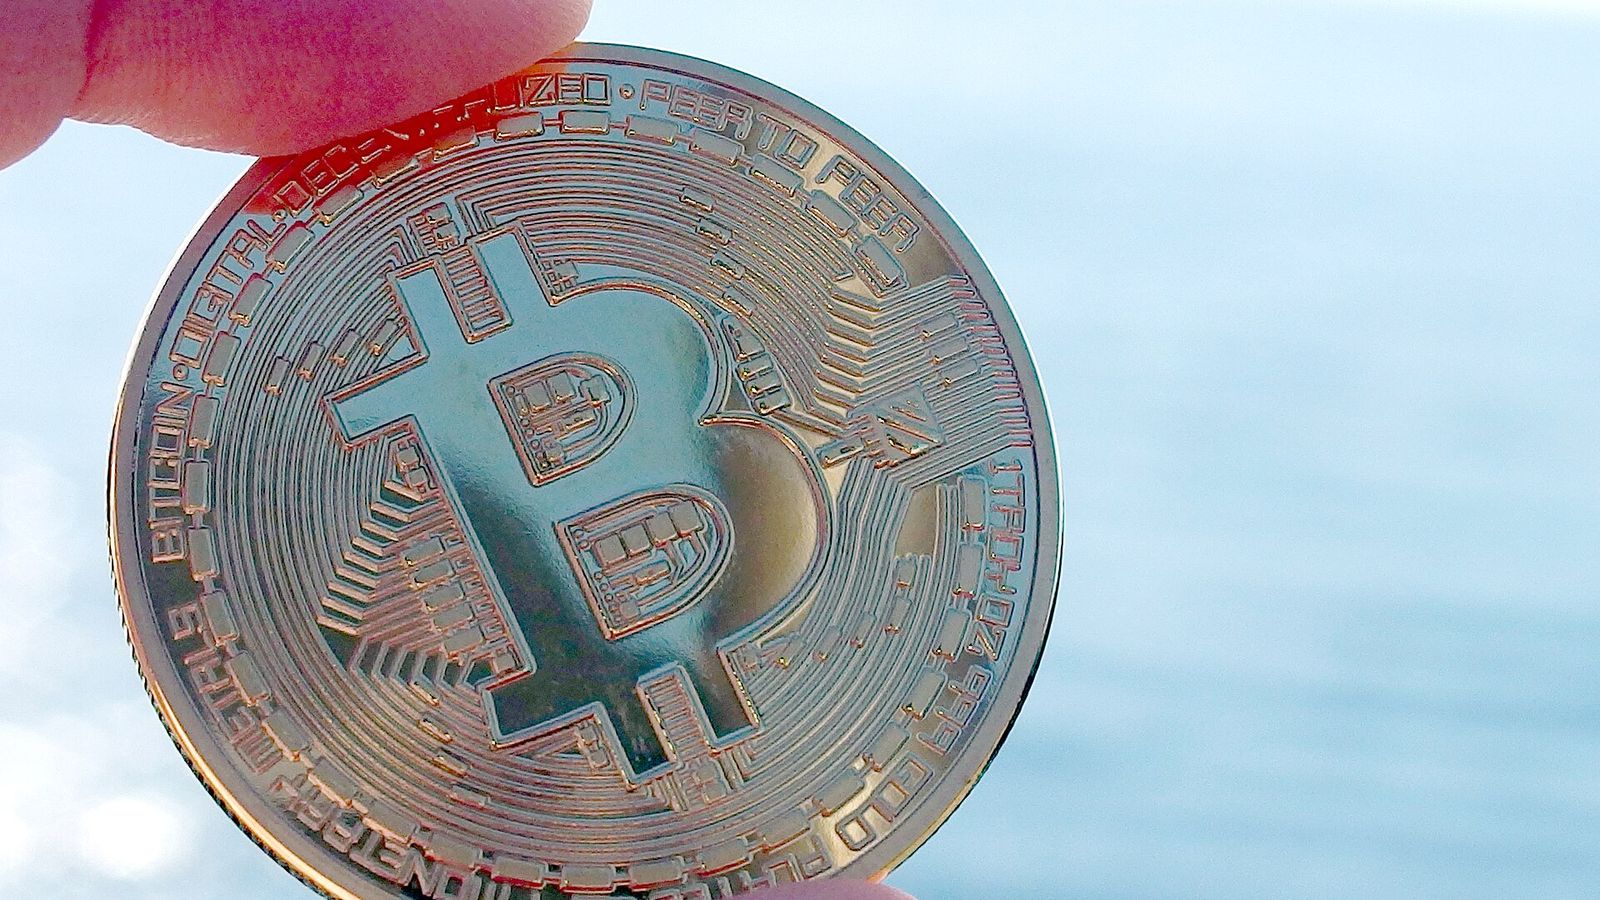
October closed at $77,582.02, down 7.22% from an $83,623.59 open. Bitcoin held above $80,000 for the first twenty-eight sessions of the month and then lost it on three consecutive closes: $77,991.89 on the 29th, $77,368.77 on the 30th, and $77,582.02 on Halloween. The month's low, $76,325.98, was printed on 30 October, one session before the end.
The candle is ugly in every direction. The high, $87,220.00, came on 2 October — the third rejection of that exact level this year — which leaves the close 11.05% under the high and only 1.65% above the low. The range was $10,894.02, or 14.27% of the opening price, and the break came on volume: 23,832 BTC on the 29th and 24,296 BTC on the 30th, against 13,109 and 13,131 in the two sessions before. That is 1.83 times the prior pace, and the two heaviest days of the month were the two that broke it.
Advertisement
The worst October in nine years of Binance data
There are ten Octobers in Binance's BTC/USDT history. Three of them closed red: 2018 at −3.84%, 2025 at −3.89%, and this one at −7.22%. October 2026 is the weakest of the ten by more than three percentage points, and it is the first time two Octobers in a row have closed below their opens. The five Octobers from 2020 to 2024 all finished green and averaged +22.57%.
At the month-end print the year is −11.48% from $87,648.21. The 2026 high was $97,924.49 in January and the low $57,800.19 in July, so bitcoin is 20.5% under the high and 34.7% over the low — a range year that has spent the last quarter handing back the August and September recovery.
Advertisement
Zero of nineteen majors closed green
We pulled the monthly candle for every major with a USDT pair and enough history on Binance. Nineteen had an October candle. Not one closed above its open. The best of them was Bitcoin Cash at −6.86%, and bitcoin was second at −7.22% — the relative-strength trade of the month, for whatever that is worth when the leader is still down.
The rest: BNB −8.49%, TRX −9.96%, XRP −15.98%, ETH −16.02%, NEAR −16.93%, LTC −17.06%, APT −17.87%, LINK −18.77%, SOL −19.12%, ARB −19.21%, DOGE −20.02%, AVAX −21.57%, ADA −21.70%, DOT −22.63%, SUI −22.75%, XLM −25.13% and HBAR −31.41%.
The median major lost 18.77%, which is 11.55 points worse than bitcoin. The ordering is the story: the assets with the thinnest bid took the biggest hit, and the two closest to ETF and treasury flows, BCH and BTC, lost the least. When every major on the board is red in the same month, this is not a bitcoin problem — it is a repricing of the whole risk curve.
Both previous red Octobers were followed by a red November
There are nine completed Novembers in the data. Four closed green and five closed red, with a median of −7.10%. The average is +5.13%, and the average is a lie: 2017 (+52.24%), 2020 (+42.82%) and 2024 (+37.15%) drag it up on their own.
The two other red Octobers were followed by November 2018 at −36.55% and November 2025 at −17.56%, an average of −27.06%. December did not rescue either of them: −8.37% and −3.00%.
Two observations are not a sample, and this setup differs from both: bitcoin enters November 6.60% above its 20-week average and has not closed a week below that line since 10 August. The tape is not arguing with the pattern, though. The last four weekly closes are each lower than the one before — 86,530, 83,773, 82,116, 80,154 — and the week in progress is running lower again at 77,840.
The three levels that decide November
$79,220 is the shelf that was tested nine times between $79,220 and $80,684 before it broke on 29 October — the same one our daily read flagged the session it cracked. Reclaiming it is the cheapest available proof that the breakdown failed.
$83,623.60 is the September close and the October open. A November close above it would be the first green November after a red October anywhere in the data, and it would break the pattern by definition.
$76,325.98 is the October low. Behind it sits the 20-week average at $73,023.81 — a close below the monthly low would put that average in play for the first time since August, and it is the only trend line that has not been broken this quarter.
What would actually flip it
Nothing in the data says a red October has to be followed by a red November. Two draws is two draws, and both of those Octobers were smaller declines than this one: 2018 fell 3.84% and 2025 fell 3.89%, while this one gave back 7.22% and still closed 1.65% off its low. The 31 October bounce to $77,582 is the first evidence this month that sellers ran out of tape at $76,326.
The tell will not be the monthly candle. It will be whether $79,220 is reclaimed before $76,325.98 is retested, and November gets thirty sessions to answer. To track the next month-end print yourself, the site's free crypto tools carry the converter, halving tracker and mining calculator we build these numbers with.
Written by
EarnCrypto.dev Editorial
The EarnCrypto.dev editorial team researches and reviews AI mining platforms, pools and earning tools — publishing only what passes our own checks.
Related reading

Strategy Sold $431.8 Million of Bitcoin to Pay a 12% Dividend — and Every Share Now Backs 3.7% Less BTC
Strategy booked a $20.91 billion digital-asset gain, then reported a negative BTC Yield of 3.7% and $431.8 million of bitcoin sold to fund a 12% dividend.
XRP Got Its Federal Bank Charter and Gave the Whole 7.2% Back in One Session — 1.2546 Is Now the Line That Decides 1.3444 or 1.2002
The OCC chartered Ripple National Trust Bank on 26 October and BNY added XRP custody a day later. XRP ran 7.2% and erased it in one session. 1.2546 decides.

The NYSE's Owner Signed a Definitive Deal to Run Hyperliquid Perps for US Retail — HYPE Tapped 97.74, 22 Cents Under Its Record, Then Gave Back 8.7 Points
ICE will run a new US retail perp market built on Hyperliquid, pending CFTC approval. HYPE ran 78.19 to 97.74, missed its record by 22 cents, closed 89.06.