
AVAX Daily Analysis — The Wedge Broke Down and the 0.5 Stopped It 0.074 Short: 9.264 Decides 9.695 or 8.981
AVAX broke its wedge, flushed to 9.055 and stopped 0.074 above the 0.5 retracement at 8.981, then reclaimed 9.264: the 0.382 at 9.695 decides 10.054 or 8.698.
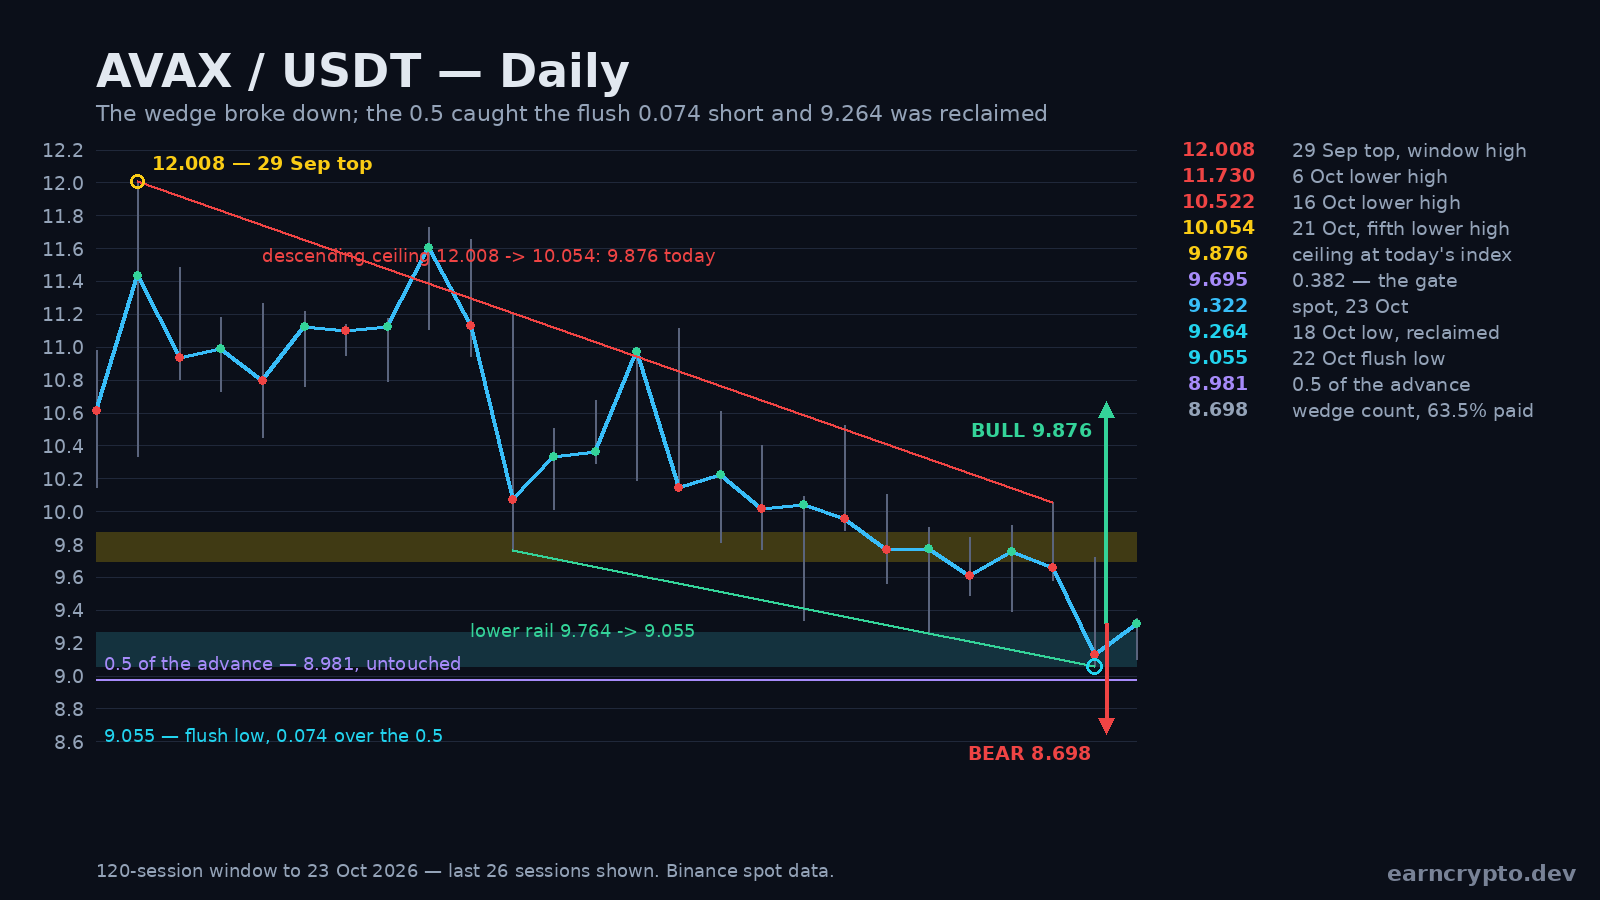
Avalanche is trading 9.328 on 23 October, 2.19% above yesterday's close and 22.32% under the 12.008 top of 29 September. The flush to 9.055 on 22 October was the lowest print since the 19 September candle that launched the rally, and it stopped 0.074 above the 0.5 retracement of the entire 5.954-to-12.008 advance at 8.981. Today's close is back above the 18 October low at 9.264, which is the first thing the bear case needed to keep.
The downleg is 2.953 points, 24.59%, in twenty-three sessions. The wedge our 18 October note drew — five lower highs against a rising floor, closing on the 0.382 at 9.6954 — resolved the wrong way on 22 October: a 5.49% session that closed at 9.128, which is 0.547 under the wedge floor at 9.675, with the low at 9.055 for 0.620 through it. The measured count of that wedge was 0.977 points and it projected 8.698.
Advertisement
The Wedge Broke Down and the 0.5 Caught It
The 22 October session printed 9.055 and closed at 9.128, 0.073 off the low, which is 63.5% of the 0.977-point count and 0.074 above the 0.5 at 8.981. It did it on 2.4 million AVAX, 0.73x its own trailing twenty-day average — a breakdown on lighter tape, not a capitulation, and the 0.81% close off the low is what separates a sweep from a trend day. The 0.5 had not been traded since 19 September, so the first test of it was refused by seven cents.
The 18 October Low Has Been Reclaimed
9.264 was the 18 October low and the last higher low of the wedge. Today opened at 9.127, held 9.098 and closed at 9.328 — 0.064, or 0.69%, above it — while the 9.055 low from 22 October sits intact underneath. Both sit inside the same fib ladder: 9.264 is 0.283 over the 0.5 at 8.981, and 9.695 is 0.367 over today's close. Price is in the lower half of that ladder with the first of its two rails back in hand.
Advertisement
Five Peaks, Each Lower Since 29 September
12.008 on 29 September, 11.730 on 6 October, 11.115 on 12 October, 10.522 on 16 October, 10.054 on 21 October. Five highs, each below the last, and the rail through the first and last of them reads 9.876 at today's candle and 9.432 five sessions out — the ceiling is coming down faster than the lows are falling. The lows have stepped 9.764 on 8 October, 9.337 on 15 October, 9.264 on 18 October and 9.055 on 22 October, so this is a descending channel now, not the rising floor the wedge had ten days ago. It is 0.872 wide at today's index and the ceiling is 0.548 above spot.
What 9.695 Requires
A daily close above 9.695, the 0.382 of the 6.054-point advance, is the first structural requirement and would put price back inside the wedge that broke. Two levels follow quickly: the descending rail at 9.876, then the 21 October high at 10.054 — the last of the five lower highs, so a close above it would end the sequence that has defined the month. Above that the 0.236 at 10.579 is the measured target of the channel, with the 16 October high at 10.522 sitting 0.057 under it. That is a 1.251-point climb through three levels, and the invalidation is a close back under 9.264.
What a Close Under 9.264 Costs
Under 9.264 the reclaim fails and 9.055 is back in play. Under 9.055 the 0.5 sits 0.074 away and the wedge count at 8.698 is 0.357 below it, with the 0.618 at 8.267 as the last shelf of the advance. The honest shape of that path is not a straight line: the 15 October session swept 9.337 and closed at 10.042, 7.5% off its low, so a bounce out of the 9.0 handle is the base case and only a close under 8.981 confirms the count. That 0.074 gap is the whole difference between a sweep of the first fib and a break of it.
Momentum Lost the Fifty-Day Two Sessions Ago
Price is 9.4% under the twenty-day at 10.206 — twelve closes below it, the last above on 11 October — and 3.2% under the fifty-day at 9.627, which broke on 22 October, the first close under it since 19 August. The hundred-day at 8.192 is still 12.2% under spot, which is why the 8.698 count is not a free fall but the second half of a correction. RSI(14) is 41.6 and ATR(14) is 0.604, 6.48% of spot — one average day covers most of the 9.264-to-9.695 band that has to be resolved. Today's range of 0.252 is 40% of the twenty-day average of 0.625 and volume is a 0.09x pace on a partial session.
The wedge broke downward and the 0.5 caught it 0.074 short. 9.264 is the first vote; 9.695 and 8.981 are the two ways it can be paid.
The three numbers for the next session are 9.264, 9.695 and 8.981. Above 9.695 the rail at 9.876 and the 10.054 high come into play; below 8.981 the wedge count at 8.698 is the target.
Data: AVAX/USDT daily candles on Binance, Avalanche on CoinGecko and the AVAXUSDT chart on TradingView.
Written by
EarnCrypto.dev Editorial
The EarnCrypto.dev editorial team researches and reviews AI mining platforms, pools and earning tools — publishing only what passes our own checks.
Related reading
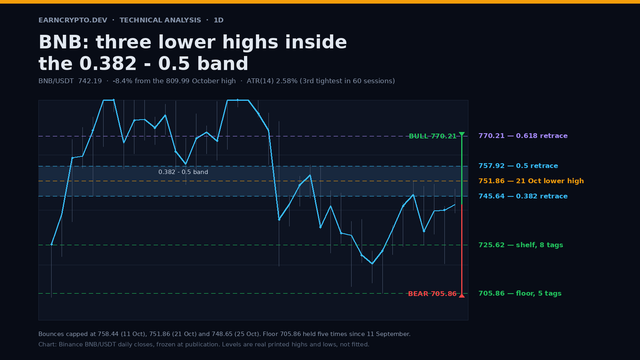
BNB Daily Analysis — A Third Lower High at 748.65 Under the 0.5 at 757.92: 745.64 Decides 770.21 or 705.86
BNB has made three lower highs — 758.44, 751.86 and 748.65 — inside the 0.382 to 0.5 band of the October slide, and 745.64 decides between 770.21 and 705.86.
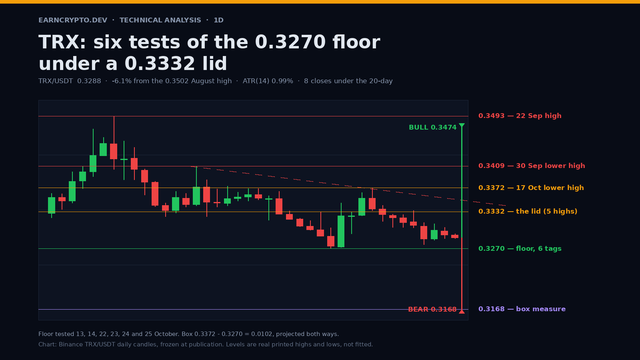
TRX Daily Analysis — Six Tests of the 0.3270 Floor Under a 0.3332 Lid: 0.3168 or 0.3474
TRX has printed six sessions of lows inside 0.0017 on the 0.3270 floor while a 0.3332 lid caps every bounce, and the 0.0102 box projects 0.3168 or 0.3474.
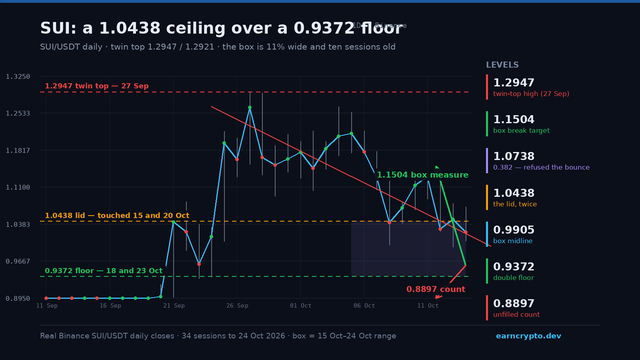
SUI Daily Analysis — A Twin Top at 1.2947 and a Ten-Session Box: The 0.9372 Floor Decides 1.1504 or 0.8897
SUI's 27.6% slide stopped twice at 0.9372 and the lid twice at 1.0438. The box has held for ten sessions and is 11.1% wide — here is where a break pays out.