
AVAX Daily Analysis — A 12.008 Poke Above the 11.799 Top Closed 0.572 Off Its High: The 10.145 Retrace Decides 12.83 or 9.97
AVAX ran 7.169 to 11.799 in five sessions, coiled seven in a 9.966-11.400 box, then poked 12.008 and gave 41% back. The 10.145 retrace decides 12.83 or 9.97.
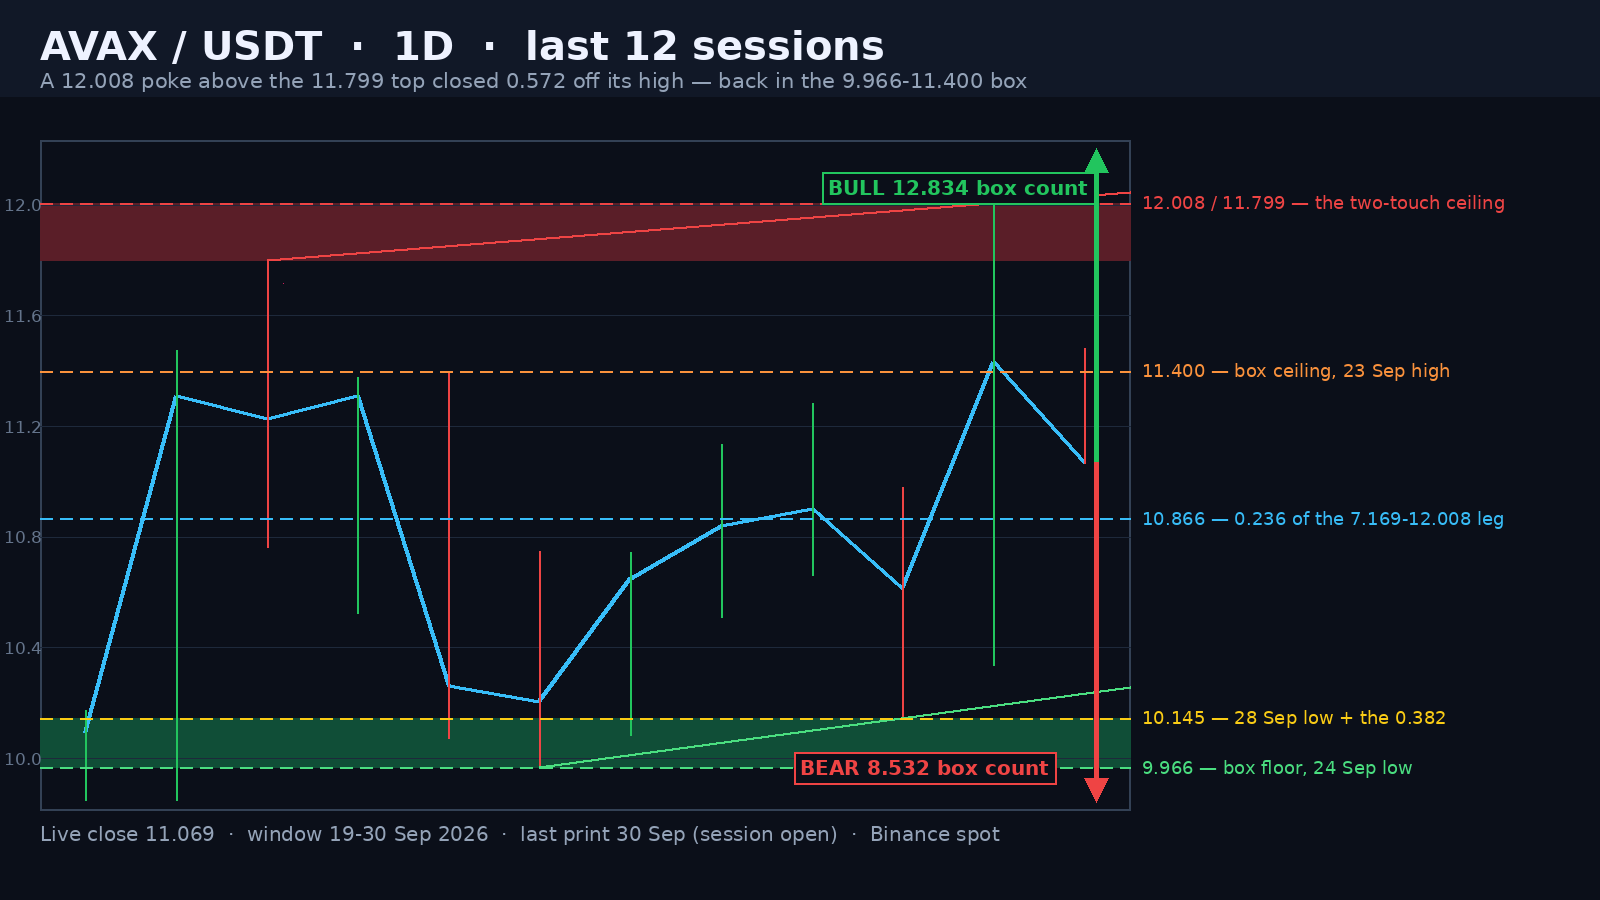
Avalanche is trading at 11.059 in the opening hours of the 30 September session, 7.90% under the 12.008 high it printed yesterday — the 120-session top — and 95% above the 5.681 low of 19 June. Today's range is 0.451 points, 4.08% of spot, on a 0.29x full-day volume pace against the 20-day average of 5,175,091 AVAX. Yesterday is the session that matters: it ran 10.617 to 12.008 — 1.391 points — on 10,479,523 AVAX, 2.19x the average, and closed 11.436, keeping 0.819 of the advance and handing back 41% of it.
Five Sessions From 7.169 to 11.799, Then Seven Sessions in a Box
Nothing in this chart is older than two weeks. AVAX closed 7.477 on 16 September and 11.313 on 20 September — a 51% move in four sessions — on volume that ran 2.46x, 3.51x and 4.77x the 20-day average, the last of those the heaviest print in the entire 120-session window at 14,361,578 AVAX. The 21 September candle tagged 11.799 and closed back at 11.231. Then the market stopped: seven sessions between the 24 September low of 9.966 and the 23 September high of 11.400 — a 1.434-point box, 12.9% of spot — on volume that faded to 1.37x, 1.38x, 1.13x, 1.04x, 0.95x, 0.93x and 1.14x. The 30-day return is +53.8%, second only to SUI's +59.9% among the twelve majors, and the RSI sits at 75.1. That is a rest after a vertical move, and it is the box — not the 11.799 top — that yesterday's candle was testing.
Advertisement
Yesterday: A 12.008 Poke, a 2.19x Volume Print, and a 3.6-Cent Close
The 29 September candle opened 10.617, printed a low of 10.336, ran to 12.008 — 20.9 cents above the 21 September top and 0.608 above the box ceiling — and closed at 11.436. Volume was 10,479,523 AVAX, 2.19x the 20-day average and the heaviest print since 20 September. The anatomy is what matters: the close finished 0.036 above the 11.400 box ceiling — a 3.6-cent break of the level that defines the entire structure — while giving back 0.572 of the 1.391 points it travelled from the open, 41% of the advance. A candle that takes out a seven-session box and a two-week high and keeps almost nothing is a wick, not a breakout. Today it has already traded back under the 11.400 box ceiling, and the two prints above 11.70 in the whole window — 11.799 and 12.008 — remain the only evidence of a ceiling at all.
The Retrace Rungs, and Where the Two Counts Land
Measured from the 16 September low of 7.169 to yesterday's 12.008 high — 4.839 points — the retracement rungs sit at 10.866 (0.236), 10.160 (0.382), 9.589 (0.5) and 9.018 (0.618). The 0.382 is the one that matters, because the 28 September low printed 10.145 — 1.5 cents under it — and that low is also the last higher low before the breakout attempt. The box measures 1.434 points, so a genuine break of the 11.400 ceiling projects 12.834, while the loss of the 9.966 floor projects 8.532. Treat the top as a double top instead — 11.799 on 21 September, 12.008 on 29 September, with the 9.966 box floor as the neckline — and the count is 2.042 points, landing at 7.924. That is the 16 September low where the entire move began, and it is the level that would turn this from a pullback into a completed top.
Advertisement
What Each Side Needs
The bull case does not need a new high today; it needs the 10.145 shelf to keep holding. That print is the 28 September low and the 0.382 in one place, and as long as daily closes stay above it, the seven-session box remains a rest rather than distribution. A reclaim of 11.400 followed by a daily close over 11.799 puts the 12.008 poke back in play, and above 12.008 the box count opens 12.834 — just under the 13.00 round number. The bull case is cancelled by a daily close under 10.145; a single wick below it does not count. Note how much air sits underneath: the 20-day average is 9.513 and the 50-day 8.137, more than 13% below spot, so a trend break would arrive with no nearby support to catch it.
The bear case starts at the same 10.145 and does not ask much. Losing it on a close opens the 9.966 box floor, and because that floor doubles as the neckline, a close under 9.966 converts the whole 9.966-11.400 range into a topping structure and activates the 7.924 count, with the 0.5 at 9.589 on the way. The momentum context argues for patience rather than certainty in both directions: the 14-day ATR is 0.982 points — 8.85% of spot, the second-highest of the twelve majors behind SUI's 9.19% — so one session can cover the distance between the two triggers, and the RSI at 75.1 says the last leg was extended. Both sides of this trade are decided by daily closes, not by intraday wicks.
Written by
EarnCrypto.dev Editorial
The EarnCrypto.dev editorial team researches and reviews AI mining platforms, pools and earning tools — publishing only what passes our own checks.
Related reading

SOL Weekly Analysis — A 17-Week Doubling Topped Twice at 124.95 / 123.76: The 116.32 Neckline Decides 124.95 or 100.19
SOL doubled 107.8% in 17 weeks into a 124.95 / 123.76 two-touch top and paid its 108.29 count to 105.71. The 116.32 neckline decides 124.95 or 100.19.

AVAX Weekly Analysis — A 55.2% Thrust and Four 2x-Volume Weeks Under a 12.008 Two-Touch Top: The 10.866 Retrace Decides 14.25 or 8.387
AVAX ran a 55.2% week on 2.27x volume, then coiled four weeks under an 11.799 / 12.008 two-touch top. The 10.866 line decides 14.25 or the 8.387 count.

ETH Daily Analysis — A 2,392.96 Count 94% Filled and Five Rising Lows Back at the 0.382: The 2,635 Line Decides 2,777 or 2,406
ETH's 2,807/2,600 distribution left a 2,392.96 count that went 94% filled at 2,406.11. Five rising lows have retaken the 0.382 — 2,635 decides 2,777 or 2,406.