
ADA Daily Analysis — Six Lower Highs Ended at 0.2073 and a Double Bottom Held 0.20050: 0.2086 Decides 0.2167 or 0.1924
ADA fell 29% in eighteen sessions, held 0.2005 twice and broke its lower-high rail today. A close over 0.2086 targets 0.2122; under 0.2005 measures 0.1924.
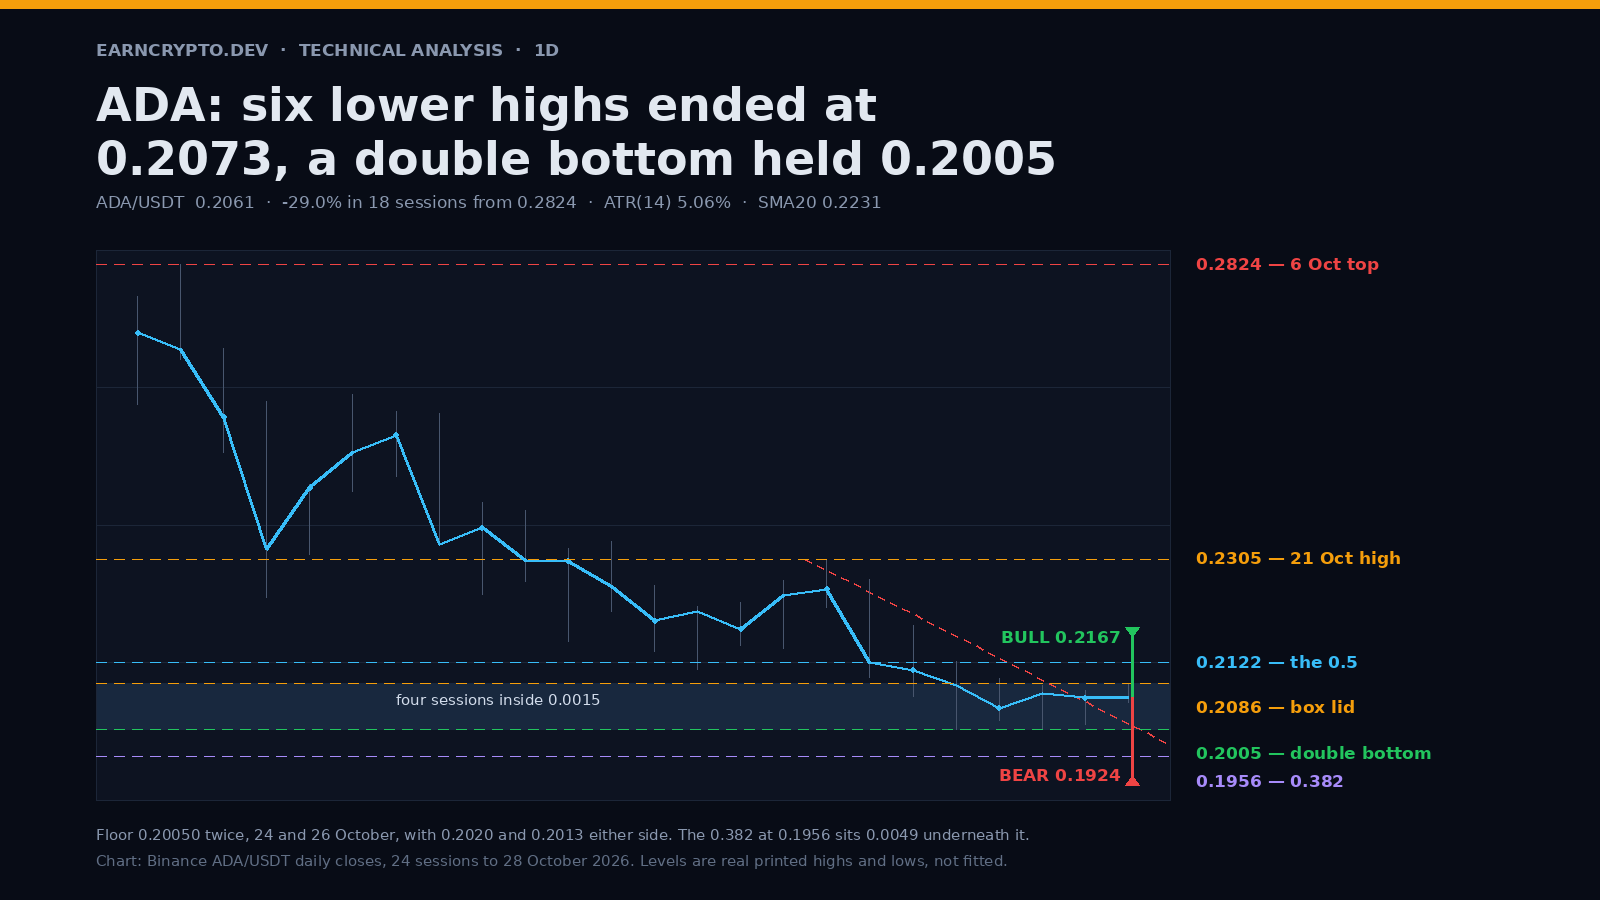
Twenty-nine per cent in eighteen sessions
Cardano topped at 0.28240 on 6 October on 218.1 million tokens, 1.13 times its trailing twenty-day average. That matters: the top was not a blow-off. The heaviest session of the whole decline came two days later, 8 October, at 290.5 million, 1.43x, when price lost 9.2% and closed at 0.23220.
Eighteen sessions later the market printed 0.20050, a 29.0% give-back. On the way there were two failed bounces, 0.2595 on 10 October and 0.2565 on 11 October, and then a lower platform at 0.2305 on 21 October. Spot is 0.2062 at the time of writing, 27.0% under the top and 2.8% over the low.
Advertisement
The decline was not a capitulation. The 22 October session that broke the 0.5 traded 98.3 million, 0.69 times its trailing average, and the five sessions since have averaged 61.5 million against a twenty-day mean of 99.4 million. Price fell 29% on below-average volume, which is drift rather than distribution — and it means there is no washed-out seller here to mark a low.
A double bottom at 0.20050
Two sessions printed exactly 0.20050: 24 October and 26 October. Either side of them, 25 October bottomed at 0.20200 and 27 October at 0.20130, so four consecutive sessions were capped inside 0.0015, or 0.73% of spot. Today's low is 0.2052, the highest of the five.
Advertisement
Where that floor sits is the part that matters. The advance ran from 0.14200 on 1 July to 0.28240 on 6 October, 0.1404 points, and the 0.382 retrace is 0.19563. The 24 October low stopped 0.0049 above it. A corrective leg that stalls that close to a 38.2% and then holds for four sessions is the most common way a counter-trend bounce begins.
Above the floor the market has been compressing. The 0.5 retrace at 0.21220 was the 22 October close, 0.21230, two ticks above it, and no close since has been above that level. That makes 0.2122 the line between a bounce and a trend change.
The bull case: 0.2086, then 0.2122
ADA printed six consecutive lower highs from 0.2305 on 21 October down to 0.2073 on 27 October: 0.2269, 0.2188, 0.2125, 0.2095, 0.2082 and 0.2073. Today's 0.2086 ended the run, and it did so against a rail drawn through the 21 and 27 October highs, which projects 0.2034 for today. The high is 0.0052 above it.
The gate is today's high at 0.2086, which is also the lid of the four-session box. A close above it opens 0.2122, the 0.5, and the box's own height of 0.0081 measures 0.2167 from the lid — 5.1% above spot, and it needs 0.2122 to break first.
I give that path roughly 55% on a one-week view. The double bottom, the highest low in five sessions and a rail that broke on the first attempt all lean that way. What does not lean that way is the 20-day average at 0.2231, 8.3% above spot and still falling. A bounce into it is a bounce, not a reversal.
The bear case: 0.2005 and the 0.1924 measure
A close under 0.20050 breaks the double bottom and projects 0.0081 lower, to 0.19240. The 0.382 at 0.19563 comes first, 0.0049 under the floor, and the measured target sits 0.0032 under the fib — with the 16 September swing low at 0.19030 just beneath it, the three levels stack inside 0.005.
The volume case cuts both ways. A four-session floor broken on a 0.69x tape, like 22 October, tends to get reclaimed, so if 0.2005 goes on less than 99 million I would read it as a sweep. If it goes on more than 149 million, 1.5x the twenty-day average, the double bottom is dead and 0.1956 is the next stop.
Under 0.19030 the window has nothing until 0.17460 from 18 August, so a genuine breakdown is a fast move. That is the tail, not the base case.
What invalidates both
Bull invalidation is a daily close under 0.20050: that kills the double bottom and puts 0.1956 in play immediately. Bear invalidation is two consecutive closes above 0.2122, which reclaims the 0.5 and turns the 23 October break into a failed breakdown.
Between 0.2005 and 0.2086 the box is 3.9% wide against a 5.06% ATR. The middle of it is the worst place on this chart to hold a position, because one average session is wider than the whole box — exactly the setup that stops both sides out before it resolves.
Twenty-nine per cent down on 0.69x volume is drift, not distribution. Drift ends when the floor gets bought, not when it gets flushed.
Written by
EarnCrypto.dev Editorial
The EarnCrypto.dev editorial team researches and reviews AI mining platforms, pools and earning tools — publishing only what passes our own checks.
Related reading
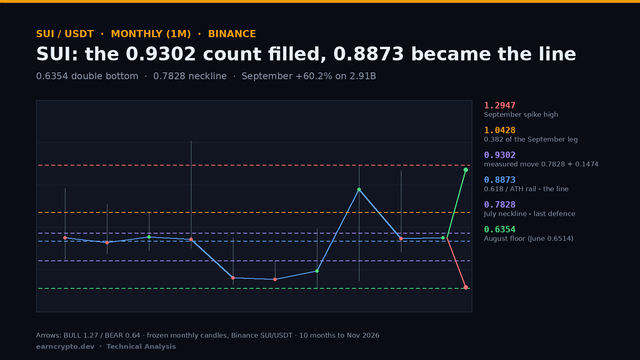
SUI Monthly Analysis — A 0.6354 Double Bottom Filled Its 0.9302 Count: The 0.8873 Retrace Decides 1.0428 or 0.7828
SUI filled the 0.9302 count of its 0.6354 double bottom at September's high and gave 22.8% back in October. The 0.8873 retrace now decides 1.0428 or 0.7828.
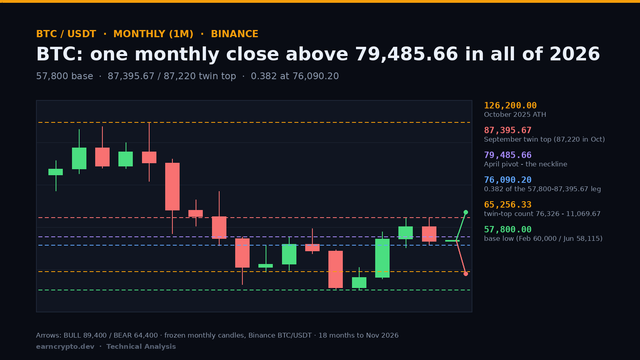
BTC Monthly Analysis — A Single 2026 Close Above 79,485.66 and an 87,395.67 Twin Top: 76,090 Decides 89,400 or 65,256
BTC closed October at 77,582, -7.2% under its open and back below the 79,485.66 pivot. The 76,090.20 retrace now decides whether 89,400 or 65,256 comes first.
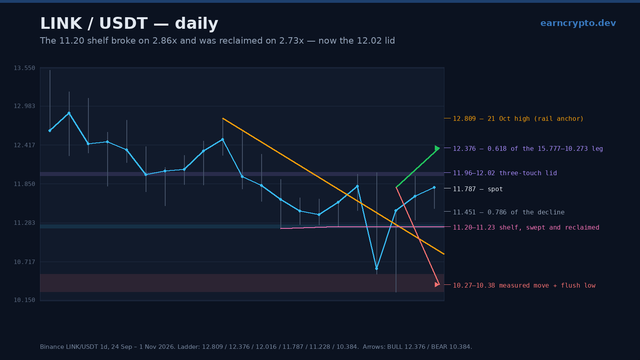
LINK Daily Analysis — The 11.20 Shelf Broke on 2.86x and Was Reclaimed on 2.73x: The 12.02 Lid Decides 12.38 or 10.38
Chainlink swept the 11.20 shelf on 2.86x volume, reversed the whole break on 2.73x and now fights a three-touch 11.96-12.02 lid. 12.02 decides 12.38 or 10.38.