
ADA Daily Analysis — A 0.2654 Peak and Eight Sessions of Lower Highs Over the 0.382: The 0.2477 Line Decides 0.2827 or 0.2279
Cardano's 39.5% leg topped at 0.2654 and eight sessions of lower highs have held above the 0.382 retrace at 0.2367. The 0.2477 line decides 0.2827 or 0.2279.
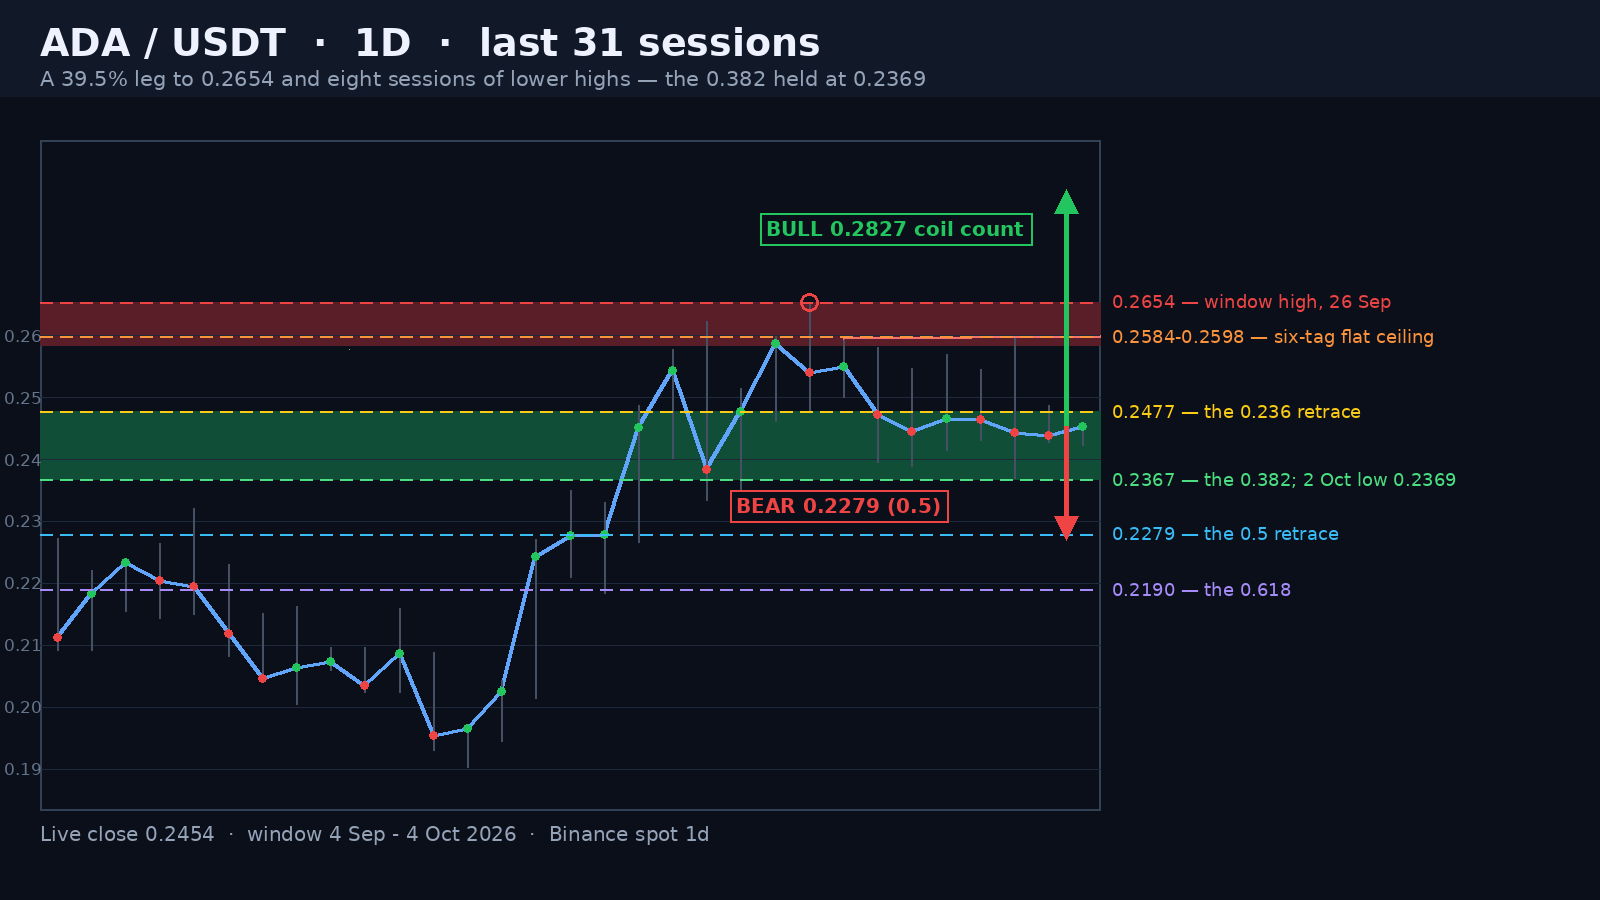
Cardano is trading at 0.2451 in the opening hours of the 4 October session, 7.65% under the 0.2654 high of 26 September and 28.8% above the 0.1903 low of 16 September that started the move. Today's range is 0.0033 points, 1.35% of spot, on a 0.12x full-day volume pace against the 20-day average of 182.8 million ADA. Everything that matters sits inside a 9.5% band: the 0.236 retracement at 0.2477 above, the 0.382 at 0.2367 below, and a market that has closed three sessions in a row inside a fraction of a cent between them.
A 39.5% Leg to 0.2654 and Eight Sessions of Lower Highs
The leg ran from 0.1903 on 16 September to 0.2654 on 26 September — 0.0751 points, or 39.5%, in ten sessions, with three of them doing the heavy lifting: 18 September +10.76%, 21 September +7.55% and 22 September +3.75%, all on volume above 240 million. Since the 0.2654 print the market has not been able to reproduce a single close above 0.2551. Eight sessions, and the highest print in all of them is 0.2598 on 2 October — 56 ticks under the peak. That is not an accident of one candle either: six sessions inside the window have traded at 0.2584 or better — 22 August at 0.2584, 23 September at 0.2623, 25 September at 0.2598, 26 September at 0.2654, 27 September at 0.2596 and 2 October at 0.2598 — and the highest close in the entire four months is 0.2588. The 0.2584 - 0.2654 band is supply, and it has absorbed every attempt.
Advertisement
The 0.382 Held Two Ticks Above the 2 October Low
Underneath, the retracement has been bought with unusual precision. The leg's 0.236 sits at 0.2477, the 0.382 at 0.2367, the 0.5 at 0.2279, the 0.618 at 0.2190 and the 0.786 at 0.2064. The 2 October session ran to 0.2598 and sold to 0.2369 — 0.000188, or under two ticks, above the 0.382 — before closing 0.2444. A 37.9% retracement of a 39.5% advance, stopped to the tick at the level the arithmetic says it should stop at. It was not a one-off either: 28 September had already printed 0.2395 and 29 September 0.2389 in the same shelf, and both were bought. The 20-day average at 0.2373 sits inside that zone and is still rising, which is why the pullback has not broken anything yet.
Collapsing Volume and a Three-Session Close Band
The pullback is running out of sellers rather than running out of buyers. The 3 October session traded 70.75 million ADA — 0.39x the 20-day average and the lightest completed session of the last three weeks, against the 240.9 million that accompanied the 2 October sweep. The last three closes read 0.2444, 0.2438 and the current print, which is a band of well under one percent, sitting precisely between the 0.382 at 0.2367 and the 0.236 at 0.2477. Compression like that resolves on a close, not on a wick, and it usually resolves in the direction of the trend that produced it — which here is still up, with spot 3.4% above a rising 20-day average and 12% above the 50-day at 0.2189.
Advertisement
Measured Move and What Each Side Needs
The bull case begins at 0.2477, the 0.236 retrace. A daily close above it puts the 0.2545 - 0.2598 pocket in play, and a close above 0.2598 breaks the eight-session ceiling for the first time since 25 September. That opens a retest of 0.2654, and above the peak there is no print anywhere in the 120-day window, so the market would be in clear air. The consolidation between 0.2369 and 0.2598 measures 0.0229 points, projecting 0.2827 on a confirmed break — a target that sits right on the extension of the 16 - 26 September impulse and needs the 0.2654 high cleared first.
The bear case needs the close, not the wick. A daily close under 0.2422, the bottom of the three-session band, puts 0.2369 back in play; a close under the 0.382 at 0.2367 confirms the first real crack in the structure and opens 0.2279 at the 0.5 and 0.2190 at the 0.618, with the 0.2140 box count underneath. Bear in mind the 14-day ATR is 0.0158, or 6.46% of spot, so an average session can travel from 0.2297 to 0.2613 on its own — the intraday prints inside that band are noise. RSI at 60.0 leaves momentum room in both directions, and the path of least resistance still leans to the bulls at roughly 55/45 while the 0.382 holds. A close under 0.2367 kills the bullish read; a close above 0.2598 kills the bearish one.
Written by
EarnCrypto.dev Editorial
The EarnCrypto.dev editorial team researches and reviews AI mining platforms, pools and earning tools — publishing only what passes our own checks.
Related reading

SOL Weekly Analysis — A 17-Week Doubling Topped Twice at 124.95 / 123.76: The 116.32 Neckline Decides 124.95 or 100.19
SOL doubled 107.8% in 17 weeks into a 124.95 / 123.76 two-touch top and paid its 108.29 count to 105.71. The 116.32 neckline decides 124.95 or 100.19.

AVAX Weekly Analysis — A 55.2% Thrust and Four 2x-Volume Weeks Under a 12.008 Two-Touch Top: The 10.866 Retrace Decides 14.25 or 8.387
AVAX ran a 55.2% week on 2.27x volume, then coiled four weeks under an 11.799 / 12.008 two-touch top. The 10.866 line decides 14.25 or the 8.387 count.

ETH Daily Analysis — A 2,392.96 Count 94% Filled and Five Rising Lows Back at the 0.382: The 2,635 Line Decides 2,777 or 2,406
ETH's 2,807/2,600 distribution left a 2,392.96 count that went 94% filled at 2,406.11. Five rising lows have retaken the 0.382 — 2,635 decides 2,777 or 2,406.