
ZEC Daily Analysis — Parabolic Top at $1,296: The $1,054 Shakeout Floor Decides the 1,377 Extension
ZEC daily technical analysis: the run high at $1,296, a 13% shakeout to $1,054 and today's 0.382 reclaim — hold 1,054 for 1,377, lose it for the 997 fill.
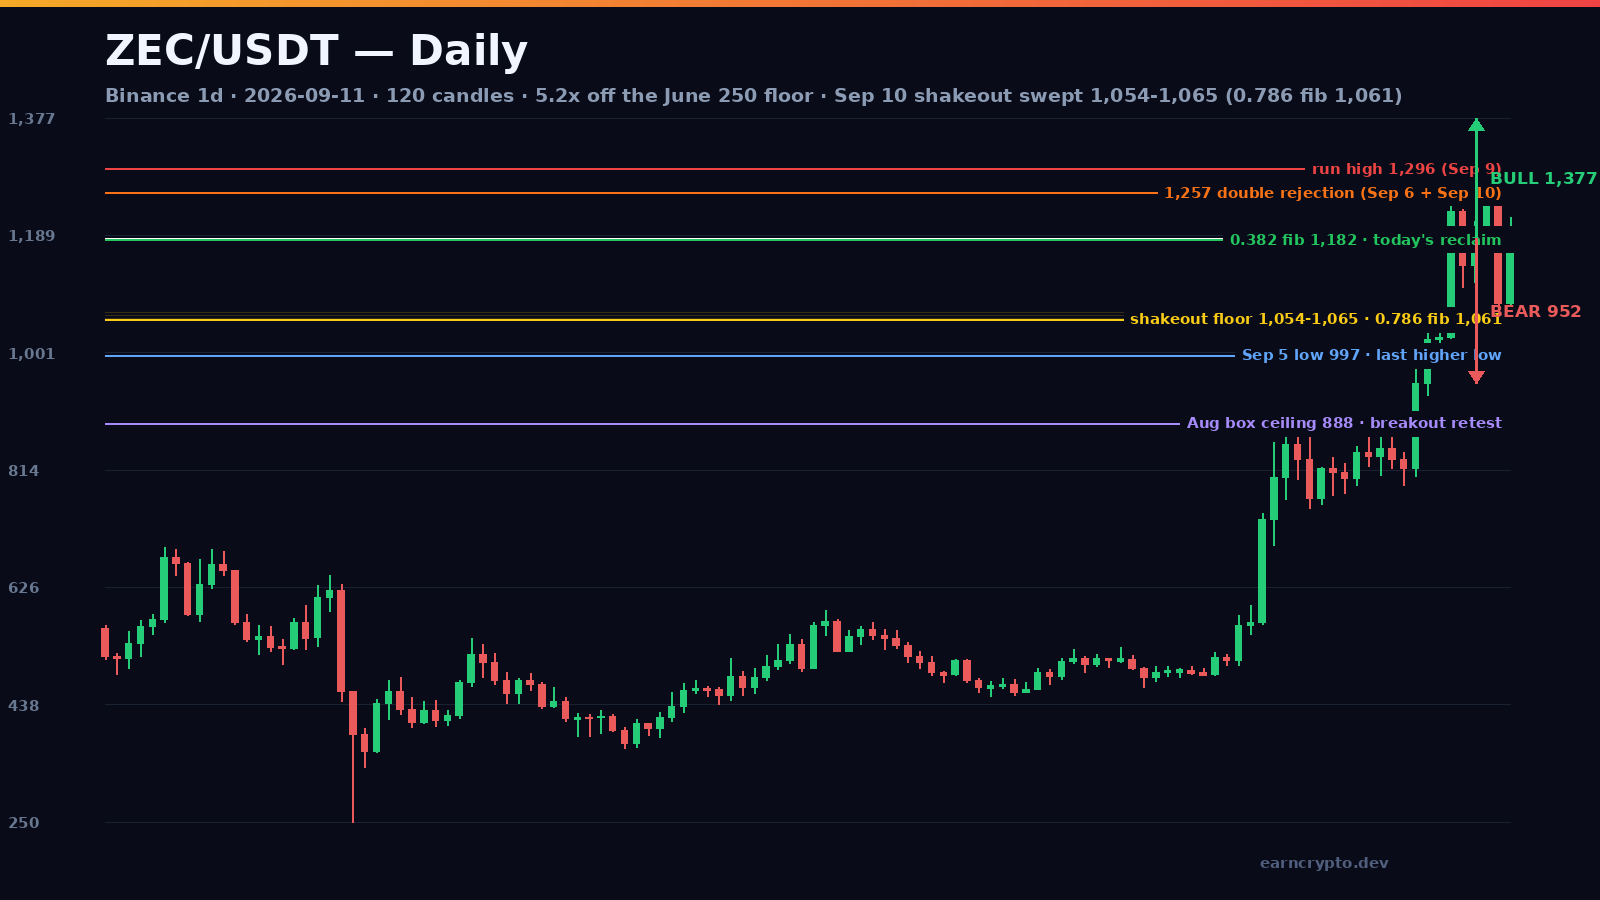
Zcash has spent September rewriting its own history, and the last two sessions have been the most violent of the move. On September 9 the price printed $1,296.02 — the top of a 418% advance from the June 5 low of $250.12. The next day it opened at $1,244.18 and closed at $1,079.96, a 13.2% range that swallowed five sessions of gains. Today it wicked to $1,054.48 and closed back at $1,184.40, reclaiming the 0.382 retracement of the final leg. That is not a trend change on its own, but it is the first time this market has been asked to prove it can hold a level instead of simply taking the next one.
The parabola: 418% off the June floor
The 120-candle chart on Binance starts on May 15 with ZEC in the $510-560 area, and it is worth remembering where this asset came from. The June 5 session flushed it to $250.12 on 2.83M ZEC — the heaviest candle in the whole window, a capitulation print roughly 92% below the October 2016 all-time high of $3,191.93.
Advertisement
What followed was a two-month base. ZEC spent July and most of August grinding between $440 and $530 on volumes that rarely cleared 250K — a market almost nobody was watching. That ended on August 19-22: a close at $565.20, then $734.30 on August 21 (+27% on 562,535 ZEC) and a high of $857.60 on August 22 on 597,910 ZEC.
August 23 to September 2 became an eleven-session box between $751.50 (August 25) and $888.40 (August 30). The box measured 136.90 points, which is why the September 3 session mattered: ZEC closed at $952.69, up 17% on 259,532 ZEC, clearing the entire ceiling in one candle. The measured move projected $1,025.30; September 4 tagged $1,050.70 and the objective was filled inside two sessions. From there the acceleration was vertical — a September 5 coil between $997.00 and $1,044.00, then a 20% candle on September 6 (open $1,025.94, close $1,227.60, high $1,256.98) on 363,500 ZEC, the heaviest session since the June capitulation. September 9 pushed to $1,296.02 and closed at $1,244.28.
Advertisement
September 10 was the first distribution day
Parabolic advances do not end with a polite consolidation — they end with a session that reverses the order flow, and September 10 was that session. Open $1,244.18, high $1,256.80, low $1,065.18, close $1,079.96: a bearish engulfing candle with a 13.2% range that finished 18% below the high printed twelve hours earlier, on 297,287 ZEC.
Here is the number that does the work. The 0.786 retracement of the final leg ($997.00 to $1,296.02) sits at $1,060.99. September 10’s low was $1,065.18 — four dollars above it. Today’s low was $1,054.48 — six dollars below it — and the session closed back at $1,184.40, up 12.3% from that low, on 322,863 ZEC, the second-heaviest candle of the month. Two sweeps of the same fib in two sessions, and not one daily close beneath it. With an ATR(14) of $113 — 9.5% of spot — a six-dollar wick under a retracement level is noise, not structure; the close is what counts, and the close refused the level.
The reclaim is worth more than the wick. Today’s close of $1,184.40 is the first close above the 0.382 retracement at $1,181.79 since the shakeout, and it also sits above the 0.236 of the wider move — the seven-session leg from the September 2 low of $788.15 to the $1,296.02 high puts that fib at $1,176.16. Two retracements three dollars apart, and price closed above both of them. That 1,176-1,182 band is now the pivot: above it the chart is a bull flag, below it the same chart becomes a lower high.
Bull path: 1,218, then the 1,257 double rejection
Holding $1,054-1,065 keeps the structure alive, and the first gate is a daily close above $1,217.77 — today’s high, and the level the last three sessions kept getting sold into. Above it the ladder runs $1,225.45 (the 0.236 retracement of the final leg), then $1,244.28, the September 9 close that September 10 opened at and abandoned.
$1,256.98 is the ceiling that decides the month. September 6 printed $1,256.98 and September 10 printed $1,256.80 — twin rejections eighteen cents apart. A daily close above that band, followed by a retest that holds, opens $1,296.02; a confirmed close above the run high projects the 1.272 extension of the final leg at $1,377.35, which is 16% above spot and a multi-week objective rather than a next-week call.
The path there will not be a straight line. Expect the 1,244-1,257 band to be sold once, a retest of 1,218 from above, and a wick back toward 1,100 before any sustained push — this market has produced a $100 daily range in three of the last five sessions, and nothing about the order flow has changed except the direction of the last candle.
Bear path: 1,054, then the 997 fill
Everything in the bear case starts with a daily close below $1,054.48. That would confirm the shakeout, put the 0.786 fib behind price instead of underneath it, and open $1,042.08 — the 0.5 retracement of the wider $788.15-1,296.02 leg, and the first confluence under the floor.
From there the ladder is $1,023.25 (September 6 low) and $997.00 (September 5 low, the last higher low and the 1.0 of the fib). Below $997 the parabolic structure is broken rather than merely cooled, and the next level with real demand history behind it is the old box ceiling at $888.40 — the level the September 3 breakout launched from, and roughly 25% below the high.
There is also a measured-move argument for the bears. The September range from $1,054.48 to $1,296.02 is 241.54 points tall, and its mid-point at $1,175.25 sits within nine dollars of today’s close. A market that closes at the middle of its own post-shock range is a market in balance — which is exactly the condition that precedes the next expansion, in either direction.
Probabilities and key levels
The lean is modestly bullish — roughly 60/40 that $1,217.77 is reclaimed before $1,054.48 is lost — but the character of the market has changed. Before September 10 every pullback was bought within a session and the highs kept extending; now there is a distribution candle on the chart, and first distribution days are usually followed by shallower highs rather than immediate new ones. RSI(14) at 67.5 is no longer pinned (it was deep in overbought territory at the high), and price sits 24% above its 20-day average of $955.27 and 71% above the 50-day at $690.63. Extended, but not stretched.
Support: $1,054.48 (today’s low, the two-sweep floor), $1,060.99 (0.786 fib), $1,042.08 (0.5 fib of the wide leg), $1,023.25 (September 6 low), $997.00 (September 5 low and last higher low), $952.69 (September 3 breakout close), $888.40 (August box ceiling). Resistance: $1,217.77 (today’s high), $1,225.45 (0.236), $1,244.28 (September 9 close), $1,256.80-1,256.98 (double rejection), $1,296.02 (run high), $1,377.35 (1.272 extension). Invalidations: the bull case dies on a daily close below $1,054.48; the bear case dies on a daily close above $1,296.02.
One context note that matters for sizing this. Grayscale’s spot Zcash ETF, ZCSH, listed on NYSE Arca on August 25 with Coinbase as custodian and a 2.5% annual fee, launched with roughly 387,000 ZEC worth about $260 million and reported $463.2 million in net assets by September 7 — a figure that reflects the price gains of the ZEC it already held as much as new money. ZEC’s own market value is now above $20 billion and the token is up 141.5% over thirty days, with the privacy-coin sector repricing from $7.1 billion to $33.6 billion across the same stretch. That flow is real, but it is one buyer among many in a move that began before the ETF existed — and at $1,184 the asset is still 63% below its October 2016 high of $3,191.93.
Watch the live order flow on Binance, the latest market data on CoinGecko, and the full interactive chart on TradingView.
ZEC ran 418% from the June $250 floor to $1,296, and the first real shakeout took 18% off it in two sessions. Two sweeps of the 0.786 fib at $1,061 and one close back above the 0.382 say the arc is still intact — the test at $1,257 is what tells us whether that was distribution or just a stop hunt.
Written by
EarnCrypto.dev Editorial
The EarnCrypto.dev editorial team researches and reviews AI mining platforms, pools and earning tools — publishing only what passes our own checks.
Related reading

SOL Daily Analysis — Three Touches Under the $120.00 Round Number: The 114.29 Retrace Decides 126.56 or 105.05
Solana has been rejected at the $120.00 round number three sessions in a row after a 25% week. The $114.29 retrace decides whether 126.56 or 105.05 comes next.

BTC Daily Analysis — The 82,300 Box Broke: The 87,396 Double Touch Decides 90,776 or 82,648
Bitcoin broke its five-week $82,300 box on 21 September and has coiled under $87,396 since. The $84,463 retrace decides whether 90,776 or 82,648 comes next.

BNB Daily Analysis — The $780.64 Ceiling Broke: The 782.98 Retrace Decides 858 or 741
BNB cleared the $780.64 ceiling that had held since September 5 and reversed to 782.75 today, two ticks off the 782.98 retracement. The measured move is 858.