
XRP Daily Analysis — The $1.388 Retest Arrives: The $1.4336 Rail Decides 1.55 or the 1.259 Fill
XRP daily technical analysis: seven touches held the $1.335-1.344 floor and the $1.388 retest arrived — reclaim $1.4336 for 1.55, lose it for the 1.259 fill.
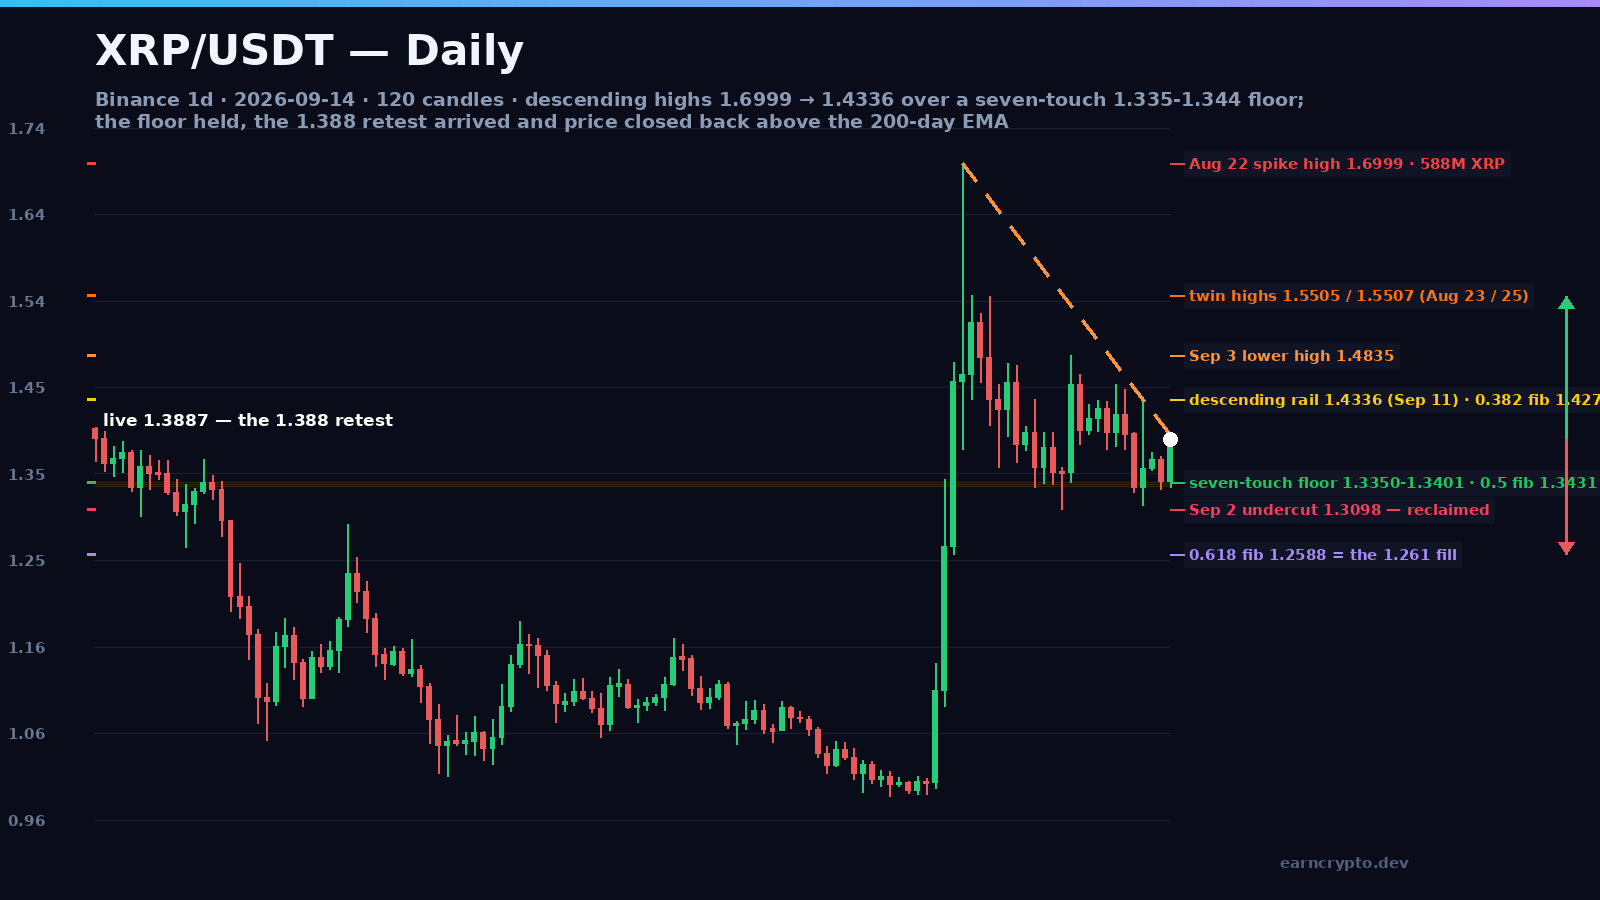
For eleven sessions XRP has been a market with a flat floor and a falling lid. Today the floor won a round. The September 14 session opened at $1.3413, dipped to $1.3350 — the seventh test of the $1.3350-$1.3401 shelf since August 30 — and has traded to $1.3906, 3.7% above the prior session's $1.3412 close and back above the 200-day EMA at $1.36911 for the first time since September 9. The $1.388 retest that the September 11 breakdown-and-reclaim flagged as the bull target is now in the books. What this session has not done is break the rail: the descending line of lower highs that has capped every rally since the August 22 spike still sits roughly 2% overhead, projecting to $1.4150 today, and its last anchoring print is $1.4336.
The 0.9862 floor, the 1.6999 spike, and the shelf in between
The 120-candle window opens on May 18 at $1.39 and spends ten weeks going the other way: a May high of $1.4027, a June 26 low of $1.0092, a July range between $1.0450 and $1.1646 — and then an August that broke the base. The low of the entire window is $0.9862 on August 14, printed on 65.9M XRP, and it is also the low of the last 400 sessions.
Advertisement
Four sessions later XRP stopped falling. August 19 opened at $1.0019 and closed at $1.1060 on 185.0M — roughly 3.7x the 50M the market had been turning over. August 20 ran to $1.3441 and closed at $1.2681 on 380.6M. August 21 printed $1.4756 on 442.2M. And on August 22 the market put in the number everything since has been measured against: a high of $1.6999 on 588.3M XRP, the heaviest candle of the window and 4.7x its 20-day average — a session that opened at $1.4543, printed $1.70, and closed at $1.4619 — 23.8 cents under its own high.
Seven lower highs, seven touches on the same floor
Since that close the highs have stepped down in a line: $1.5507 (August 23), $1.5304 (August 24), $1.5505 (August 25), $1.4835 (September 3, on 212.8M), $1.4507 (September 8), $1.4458 (September 9) and $1.4336 (September 11). A rail through the August 22 spike and the September 11 high projects to roughly $1.4150 today — which is why the floor matters more than the candles in between.
Advertisement
Underneath it the floor has not moved. Seven sessions have stopped inside a 107-tick band between $1.3294 and $1.3401: August 30 ($1.3352), August 31 ($1.3394), September 1 ($1.3382), September 3 ($1.3401), September 10 ($1.3294), September 13 ($1.3325) and today ($1.3350). Two sessions undercut it — September 2 at $1.3098 and September 11 at $1.3150 — and both were bought back the same day; September 11 closed at $1.3564 on 174.2M, the heaviest volume since September 4. A flat shelf tested seven times while the highs fall is a descending triangle, and this one is running out of room: at its current slope the rail meets the floor around September 25.
Volume is thinning while it compresses. The last three sessions have turned over 48.5M, 59.6M and roughly 43M XRP against a 20-day average of 125.5M — the quietest three-day stretch since the August ignition. Falling volume inside a triangle says the market is waiting, not deciding. That is useful information before a resolution and useless after one.
Why these levels: the 50% retracement is the floor
The impulse that frames everything measures $0.9862 to $1.6999 — 71.37 cents. Its retracements explain the last month better than any indicator: 0.382 at $1.4273, 0.5 at $1.3430 and 0.618 at $1.2588. The seven-touch floor sits within 30 ticks of the 50% line. The rail has been refusing the 0.382 since September 3 — the September 11 high at $1.4336 is 63 ticks above it, close enough that a single strong session can put the market on the wrong side of all three measurements at once.
Today's move also put XRP back above its 200-day EMA of $1.36911, which it had closed below for four straight sessions (September 10-13). The 20-day SMA at $1.38900 is where price is trading — flat, not stretched. The 50-day EMA at $1.28160 and the 200-day SMA at $1.27348 remain about 8% below spot and rising, which is the bulls' structural argument. RSI(14) at 51.2 is neutral. ATR(14) at $0.0633 — 4.56% of spot — is not: this is a market that covers 4% inside a session and then gives half of it back.
Bull case: hold the floor, take 1.4336, and the count is 1.557
The bull case starts with the floor holding a seventh and eighth time and ends at the rail. A daily close above $1.4336 would break the sequence of lower highs for the first time since August 22 and open $1.4458-$1.4507 (September 8-9), then the August 22 close at $1.4619, then the September 3 high at $1.4835, with the $1.5505-$1.5507 twin highs behind them.
The arithmetic behind the target is the triangle's own height. The range that has contained XRP since August 30 measures $1.3098 to $1.4336 — 12.38 cents. Projected from the rail it lands at $1.5574, 67 ticks above the August 23/25 twin highs at $1.5505-$1.5507. Two independent measurements in the same 2-cent band make $1.55 the first real objective above the rail; $1.6999 only becomes relevant if the whole August impulse is retraced instead.
Expect the path to be ugly. A realistic bullish sequence tags $1.4150-$1.4273, gets sold back to $1.3880-$1.3960 to rebuild, and only then makes the real attempt at $1.4336 — and the first close above it usually gets retested. Invalidation for this side of the book is a daily close back below $1.3350, not a wick under it.
Bear case: lose 1.3350 and the fill is 1.2588
The bear case needs one close. Losing $1.3350 — closing below it, not wicking through it — would turn seven touches into seven failures and put the two undercuts back in play: $1.3150 (September 11) and $1.3098 (September 2). Under them the market re-enters the thin zone the August impulse crossed in four sessions.
Then the arithmetic is exact. The 0.618 retracement of the $0.9862-$1.6999 impulse is $1.2588, the level the September 11 piece called the 1.261 fill. A second measurement agrees from the other side: the triangle's height projected down from the September 2 low gives $1.1860. The honest reading is that $1.2588 is the first magnet and $1.1389 (the 0.786) is what opens if the August impulse is fully retraced. Remember how this market arrived here — 0.9862 to 1.6999 took four sessions, and it can be given back in the same amount of time.
Probabilities and the level sheet
The lean is modestly bullish — roughly 55/45 that the floor holds into the rail before $1.3350 closes through — and it is a lean, not a forecast. For the floor: seven touches, two undercuts reclaimed on volume, a 200-day EMA reclaimed today, and the 50% retracement sitting underneath it. Against: the lid is still falling, the two sessions before today closed inside the triangle, volume is running at about a third of average, and XRP has already failed at $1.45 twice this month. What would change the lean is a daily close above $1.4336 — at that point the triangle is resolved and the count is $1.5574.
Support: $1.3350-$1.3401 (seven-touch floor), $1.3150 (September 11 undercut), $1.3098 (September 2 low), $1.2588 (0.618 fib), $1.1860 (triangle height projected from the floor), $1.1389 (0.786 fib). Resistance: $1.3906 (today's high), $1.4150 (rail projection), $1.4273 (0.382 fib), $1.4336 (September 11 high, the gate), $1.4458-$1.4507, $1.4619-$1.4835, $1.5505-$1.5507 (twin highs), $1.5574 (range count), $1.6999 (window high). Invalidations: the bull case dies on a daily close below $1.3350; the bear case dies on a daily close above $1.4336.
Watch the live order flow on Binance, the latest market data on CoinGecko, and the full interactive chart on TradingView.
Seven touches on the same 107-tick floor, seven falling highs above it, and price back over the 200-day EMA — XRP has the shape of a triangle that resolves sooner rather than later. $1.4336 decides which way.
Written by
EarnCrypto.dev Editorial
The EarnCrypto.dev editorial team researches and reviews AI mining platforms, pools and earning tools — publishing only what passes our own checks.
Related reading

SOL Daily Analysis — Three Touches Under the $120.00 Round Number: The 114.29 Retrace Decides 126.56 or 105.05
Solana has been rejected at the $120.00 round number three sessions in a row after a 25% week. The $114.29 retrace decides whether 126.56 or 105.05 comes next.

BTC Daily Analysis — The 82,300 Box Broke: The 87,396 Double Touch Decides 90,776 or 82,648
Bitcoin broke its five-week $82,300 box on 21 September and has coiled under $87,396 since. The $84,463 retrace decides whether 90,776 or 82,648 comes next.

BNB Daily Analysis — The $780.64 Ceiling Broke: The 782.98 Retrace Decides 858 or 741
BNB cleared the $780.64 ceiling that had held since September 5 and reversed to 782.75 today, two ticks off the 782.98 retracement. The measured move is 858.