
TRX Daily Analysis — A 0.36540 Failed Breakout and Six Sessions Under the Broken 0.32700 Floor: 0.32420 Decides 0.34640 or 0.28860
TRX trapped the breakout at 0.36540, gave the whole spike back to a 0.30200 double print and has now coiled six sessions under 0.32700. 0.32420 decides.
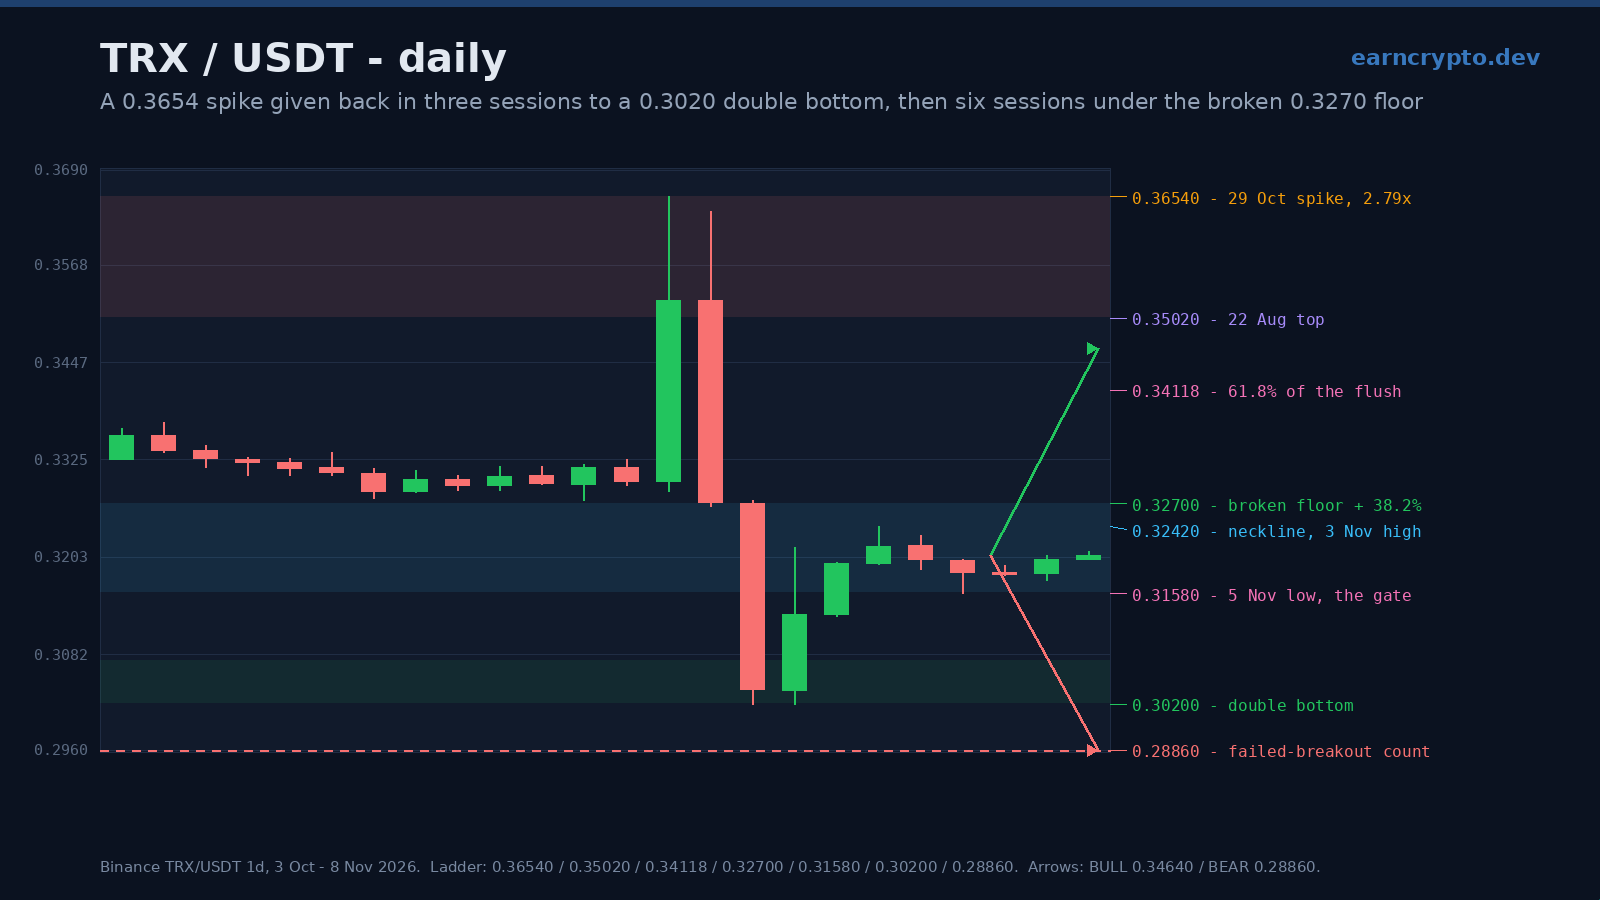
TRX closed at 0.32080 on a Sunday session that has traded 0.32000 to 0.32100 on 6.5 million tokens — a 0.06x pace against the twenty-day average of 116 million. It is the sixth consecutive close under the broken 0.32700 floor, the third session with a range under four tenths of a cent, and the lightest print of the entire hundred and twenty-session window.
What the market is doing with that quiet tape is coiling underneath a level it broke last week. The 0.32700 floor was tested three times in October — 13 October at 0.32700, 22 October at 0.32770, 27 October at 0.32740, all inside 0.0007 of each other — and it gave way on 31 October. Price has not closed above it since, and every one of the last five sessions has printed a lower high than the 3 November recovery.
Advertisement
A marginal new high, and the heaviest candle of the window
29 October opened at 0.32980, ran to 0.36540 and closed at 0.35240 on 323.3 million tokens — 2.79x the window's twenty-day average. The high was 0.01520 over the 22 August top of 0.35020: the first print above that ceiling in sixty-eight sessions, and it lasted one day.
The next session is the one that matters. It opened at 0.35240, tagged 0.36360, sold all the way to 0.32670 and closed at 0.32720 on 418.4 million tokens — 3.62x, the heaviest single candle of the entire window. That is an 11.3% intraday range that finished 0.03640 under its own high, and it handed back the whole of the 29 October advance plus the 22 August top in one session.
Advertisement
31 October finished it: a low of 0.30200, the lowest price of the window, closed at 0.30380 on 198.9 million (1.83x). 1 November printed 0.30200 a second time and closed at 0.31320 on 207.6 million (1.79x). Three sessions from 0.36540 to 0.30200 — a 17.3% round trip — with 741.7 million tokens changing hands on the first two.
0.30200, bought twice
The double print is not a textbook double bottom, because the two lows are the identical price rather than two distinct wicks. That is the stronger version: somebody with size wanted 0.30200 and took it twice, and the second test closed 0.01120 above the level — 3.70% off the low — on the heaviest buy-side volume since the flush.
2 November closed at 0.31950, the first close back over the 0.236 retracement of the flush at 0.31696, and 3 November made the recovery high at 0.32420. That high is the neckline now: it is the last swing high the market has not taken out.
Five sessions inside 0.0073, and a volume collapse
Over the last five sessions the highs are 0.32310, 0.32000, 0.31930, 0.32050 and 0.32100; the lows are 0.31880, 0.31580, 0.31800, 0.31740 and 0.32000. Five sessions inside a 0.00730 box — 2.28% of spot — against an ATR(14) of 0.01101, which is 3.44% of spot. The market is trading inside a third of its own average daily range.
Volume tells the same story: 1.07x, 0.85x, 0.99x, 0.70x, 0.51x, 0.37x, 0.06x. Six sessions of decay into a level that used to be support. A market that has stopped falling has also stopped arguing — which is exactly what a coil under resistance looks like before either side commits.
The confluence at 0.32700, and the count at 0.28860
The 0.382 retracement of the 0.36540-to-0.30200 flush is 0.32622, 0.00078 under the broken floor at 0.32700. That is the gate, and it is not a single level but a stack of measurements: the three October touches, the broken support, and the 0.382. Above it the ladder is 0.33370 at the halfway, 0.34118 at the 0.618, and 0.35183 at the 0.786 — that last one 0.00163 over the 22 August top, so the bull's full retrace lands on the old ceiling.
Below, the arithmetic is darker. October's range runs from 0.32700 to 0.36540 — 0.03840 tall — and projected down from the floor it gives 0.28860, which is 9.98% under spot and further than the 0.236 at 0.31696 would suggest. The coil itself is 0.00840 wide, so its own count is 0.30740 down and 0.33260 up.
The other side of the ledger: a double bottom at 0.30200 with the 0.32420 neckline counts 0.02220 to 0.34640, which sits 0.00543 under the 0.786. Both counts are real. Which one gets paid depends entirely on whether the reclaim of 0.32700 happens on volume or on the current 0.4x tape.
What invalidates each side
The bull read dies on a daily close under 0.31580, the 5 November low and 0.00116 under the 0.236 at 0.31696. A close there breaks the higher lows the coil is built on and reopens 0.30200 for a third test — and a level bought twice is usually lost on the third. The bear read dies on a daily close over 0.32700. Not a wick: 3 November traded 0.32420 intraday and failed, so a close above it is the first evidence since 29 October that the sellers are done.
Indicators: RSI(14) 45.1, ten-day 0.31828 — three consecutive closes above it — twenty-day 0.32533, fifty-day 0.33122, ATR(14) 0.01101 (3.44%). The pair is +2.43% on the week and -3.34% on the month. Price sits 0.00252 above the ten-day and 0.00453 under the twenty-day, which is the whole story in two numbers.
Two candles took TRX to 0.36540 and three gave it back to 0.30200, and the six sessions since have been the market deciding which of those was the accident. I lean 55/45 to the downside because a failed breakout above a ten-week ceiling that closes under its own floor rarely resolves upward without a volume event, and there has not been one. But the coil is tight enough that the gate is 2.0% away in either direction — this is a chart to trade off 0.32700 and 0.31580, not to predict.
Chart: TRX/USDT on Binance · Data: TRON on CoinGecko · Reference grid: BINANCE:TRXUSDT on TradingView. Every level on this page is drawn on the frozen 120-session daily window.
Written by
EarnCrypto.dev Editorial
The EarnCrypto.dev editorial team researches and reviews AI mining platforms, pools and earning tools — publishing only what passes our own checks.
Related reading
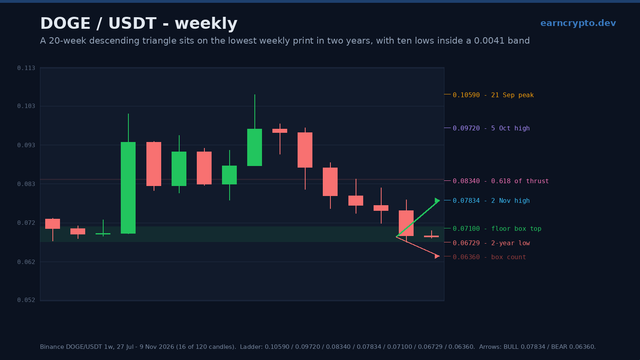
DOGE Weekly Analysis — A 20-Week Descending Triangle Is Converging on a 0.0673 Two-Year Floor: 0.0710 Decides 0.07834 or 0.0636
DOGE swept its two-year low by four ten-thousandths and closed 2.5% above it, the tenth weekly low in a 0.0673-0.0714 band. 0.0710 decides 0.07834 or 0.0636.
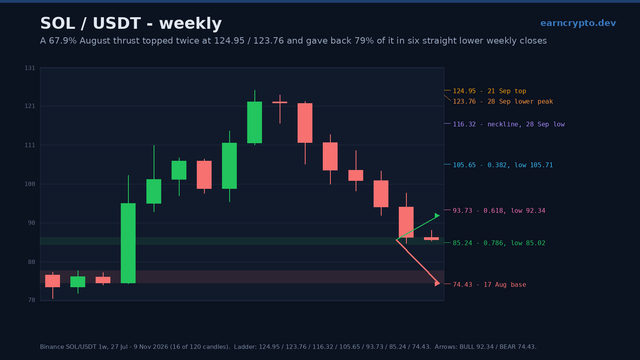
SOL Weekly Analysis — A 124.95 Double Top Has Given Back 79% of Its 50.52-Point Thrust: 85.02 Decides 92.34 or 74.43
SOL swept the 0.786 at 85.24 to 85.02 on the weekly candle and closed 1.30 back above it, after seven straight lower closes. 85.02 decides 92.34 or 74.43.
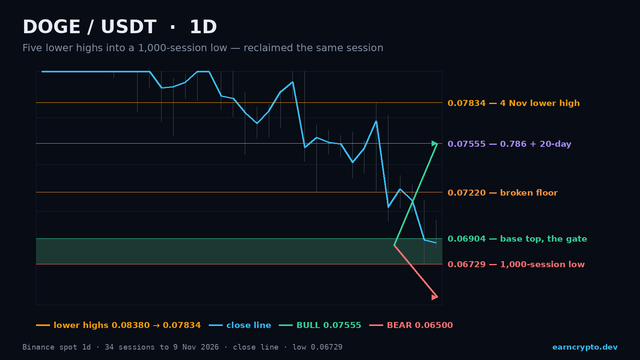
DOGE Daily Analysis — The Lowest Print in 1,000 Sessions Was Reclaimed the Same Day: 0.06904 Decides 0.07555 or 0.05624
DOGE swept 0.06729, the lowest print in 1,000 sessions, and closed back above it at 0.06896. Reclaim 0.06904 and 0.07555 opens; lose 0.06729 and 0.05624 does.