
SOL Weekly Analysis — A 124.95 Double Top Has Given Back 79% of Its 50.52-Point Thrust: 85.02 Decides 92.34 or 74.43
SOL swept the 0.786 at 85.24 to 85.02 on the weekly candle and closed 1.30 back above it, after seven straight lower closes. 85.02 decides 92.34 or 74.43.
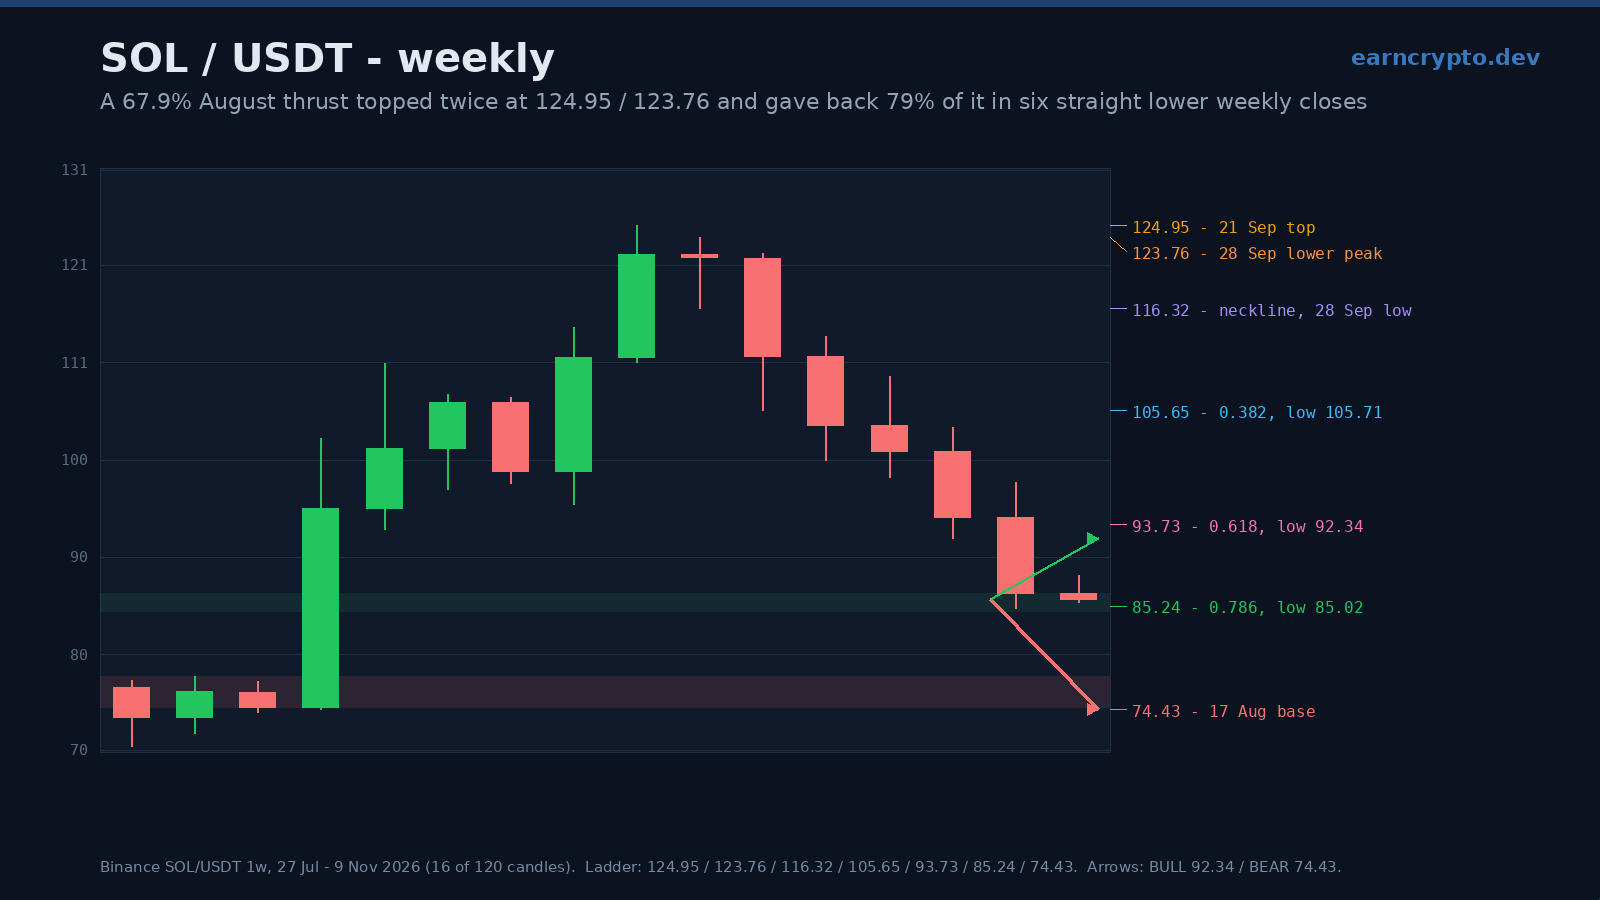
Solana closed the week of 2 November at 86.54 after trading 98.14 to 85.02 on 12.53 million SOL — an 8.45% decline that took the price 0.22 under the 0.786 retracement of the entire August-September advance and left it 1.30 back above that level at the close. Every weekly close since 21 September has been lower than the one before it, seven of them, from 121.60 to 85.60. The last four completed weeks each settled in the bottom third of their own range.
That is what a top looks like when it is being distributed rather than flushed. The advance being given back began in the week of 17 August, from a 74.43 low that closed at 95.43 on 27.17 million SOL — 3.8 times the 7.19 million of the week before — and ran to 124.95 five weeks later, a 67.9% gain. The following week printed 123.76, 0.95% below the first peak. The last weekly close within 10% of the top was 121.60, on 28 September, and nothing has come near it since.
Advertisement
Both rails of the decline are drawn on real prints
Since the double top the market has traced a descending channel, and neither rail is a guess. The ceiling runs from the 122.08 high of 12 October to the 98.14 high of 2 November. The three highs in between — 113.40, 109.20 and 103.85 — sit between 0.27 and 2.70 beneath it, which is what a rail that is actually being respected looks like. It projects 92.2 for the current week.
The floor runs from the 100.43 low of 12 October through the 85.02 low of 2 November. The 19 October low of 98.62 and the 26 October low of 92.34 both sit above it. It projects 79.9 for this week and 74.75 for the week of 16 November — 0.32 above the 74.43 low the August advance was launched from. In other words, if the channel simply continues doing what it has done for seven weeks, the entire 50.52-point advance is retraced inside two weeks. That is not a forecast; it is where the geometry arrives.
Advertisement
A ladder of fibs, each one swept and each one bought
The retracement grid over 74.43-124.95 explains this decline better than any pattern. The 0.382 is 105.65, and the 5 October low stopped at 105.71 — six cents above it. The 0.5 is 99.69, and the 19 October low of 98.62 broke it by 1.07. The 0.618 is 93.73; the 26 October low swept it to 92.34 and the week closed back at 94.53. The 0.786 is 85.24; the 2 November low swept it to 85.02 and the week closed back at 86.54.
Four rungs, four sweeps, four one-week recoveries, and no reversal. That is the signature of a market walking down a ladder rather than crashing through it — and 79% of the advance is already gone. The measured move of the double top tells the same story a different way: 124.95 minus the 105.71 neckline is 19.24 points, projected from the break that is 86.47, and the 2 November low went through it by 1.45 before closing a point and a half above.
The volume is the argument against a bottom
The five down weeks traded 12.37, 14.29, 11.78, 13.16 and 12.53 million SOL. The week that printed the top traded 22.34 million and the twenty-week average is 13.97 million, so the heaviest week of the entire decline is 64% of the week the top was made. There is no climactic print anywhere in this sequence. Bottoms of this size normally produce one, and its absence is the single strongest reason to treat 85 as a pause rather than a floor.
Under 85.02 the structure is not empty, which is the other half of the bear case. The February-March 2026 shelf sits at 76.70-81.54, where six weekly lows printed inside five points. Below it are the summer lows at 75.65, 73.39, 73.44 and 70.58, then the June capitulation at 62.34 and 60.13. A full retrace to 74.43 therefore lands on the top of a shelf that has already been tested, not in open air — and that is precisely why it is the more likely destination than a clean reversal.
What invalidates each side
The bull read dies on a weekly close under 85.02. That number is doing double duty: it is the 0.786, and it is the low of the only week since September where the market closed 1.5 points above its own low after sweeping a fib. A close beneath it puts 81.54 first and then the channel's own projection at 74.75.
The bear read dies on a weekly close above 92.34. That is the 26 October low, the first print that would end the sequence of lower highs, and — within a point — the level the channel ceiling reaches this week at 92.2. Above it, 98.14 is the next gate and the 0.5 at 99.69 the one after that. Between 85.02 and 92.34 the market is 7.32 points wide and can chop for a month without answering anything.
The read
I lean 55/45 lower over the next three weeks, and not because of the trend. The reasons are specific: 79% of the thrust is retraced, the channel floor projects a full retrace in two weeks, no week of the decline has produced a volume climax, and not one weekly close since 21 September has printed above the previous week's high. The 45% is real: the 0.786 sweep-and-reclaim on 2 November was the first time since the top that a fib rung was bought rather than sold, and one weekly close above 92.34 turns this from a channel into a base.
The number is 85.02. Above it every bounce is a bounce; below it the August advance is gone and the market goes back to pricing the summer base at 74.43. I would rather trade the reaction at 85 than predict the direction from 86.
Chart: SOL/USDT on Binance · Data: Solana on CoinGecko · Reference grid: BINANCE:SOLUSDT on TradingView. Every level on this page is drawn on the frozen 120-week weekly window.
Written by
EarnCrypto.dev Editorial
The EarnCrypto.dev editorial team researches and reviews AI mining platforms, pools and earning tools — publishing only what passes our own checks.
Related reading
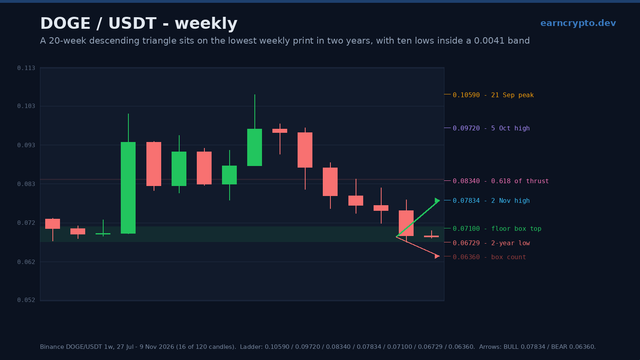
DOGE Weekly Analysis — A 20-Week Descending Triangle Is Converging on a 0.0673 Two-Year Floor: 0.0710 Decides 0.07834 or 0.0636
DOGE swept its two-year low by four ten-thousandths and closed 2.5% above it, the tenth weekly low in a 0.0673-0.0714 band. 0.0710 decides 0.07834 or 0.0636.
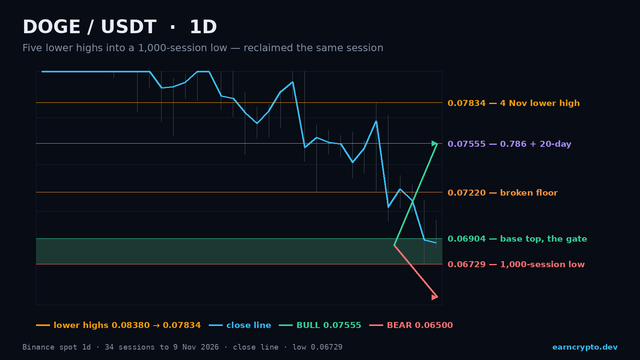
DOGE Daily Analysis — The Lowest Print in 1,000 Sessions Was Reclaimed the Same Day: 0.06904 Decides 0.07555 or 0.05624
DOGE swept 0.06729, the lowest print in 1,000 sessions, and closed back above it at 0.06896. Reclaim 0.06904 and 0.07555 opens; lose 0.06729 and 0.05624 does.
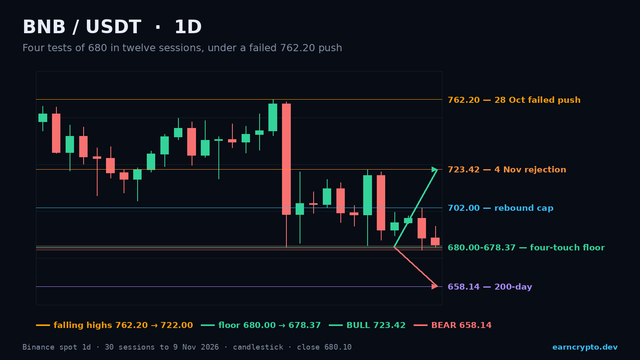
BNB Daily Analysis — A Fourth Test of 680 Under a Failed 762.20 Push: 678.37 Decides 723.42 or 635.69
BNB has printed 680 four times in twelve sessions under a failed 762.20 push. A close under 678.37 opens 635.69; reclaim 702.00 and 723.42 comes back.