
DOGE Weekly Analysis — A 20-Week Descending Triangle Is Converging on a 0.0673 Two-Year Floor: 0.0710 Decides 0.07834 or 0.0636
DOGE swept its two-year low by four ten-thousandths and closed 2.5% above it, the tenth weekly low in a 0.0673-0.0714 band. 0.0710 decides 0.07834 or 0.0636.
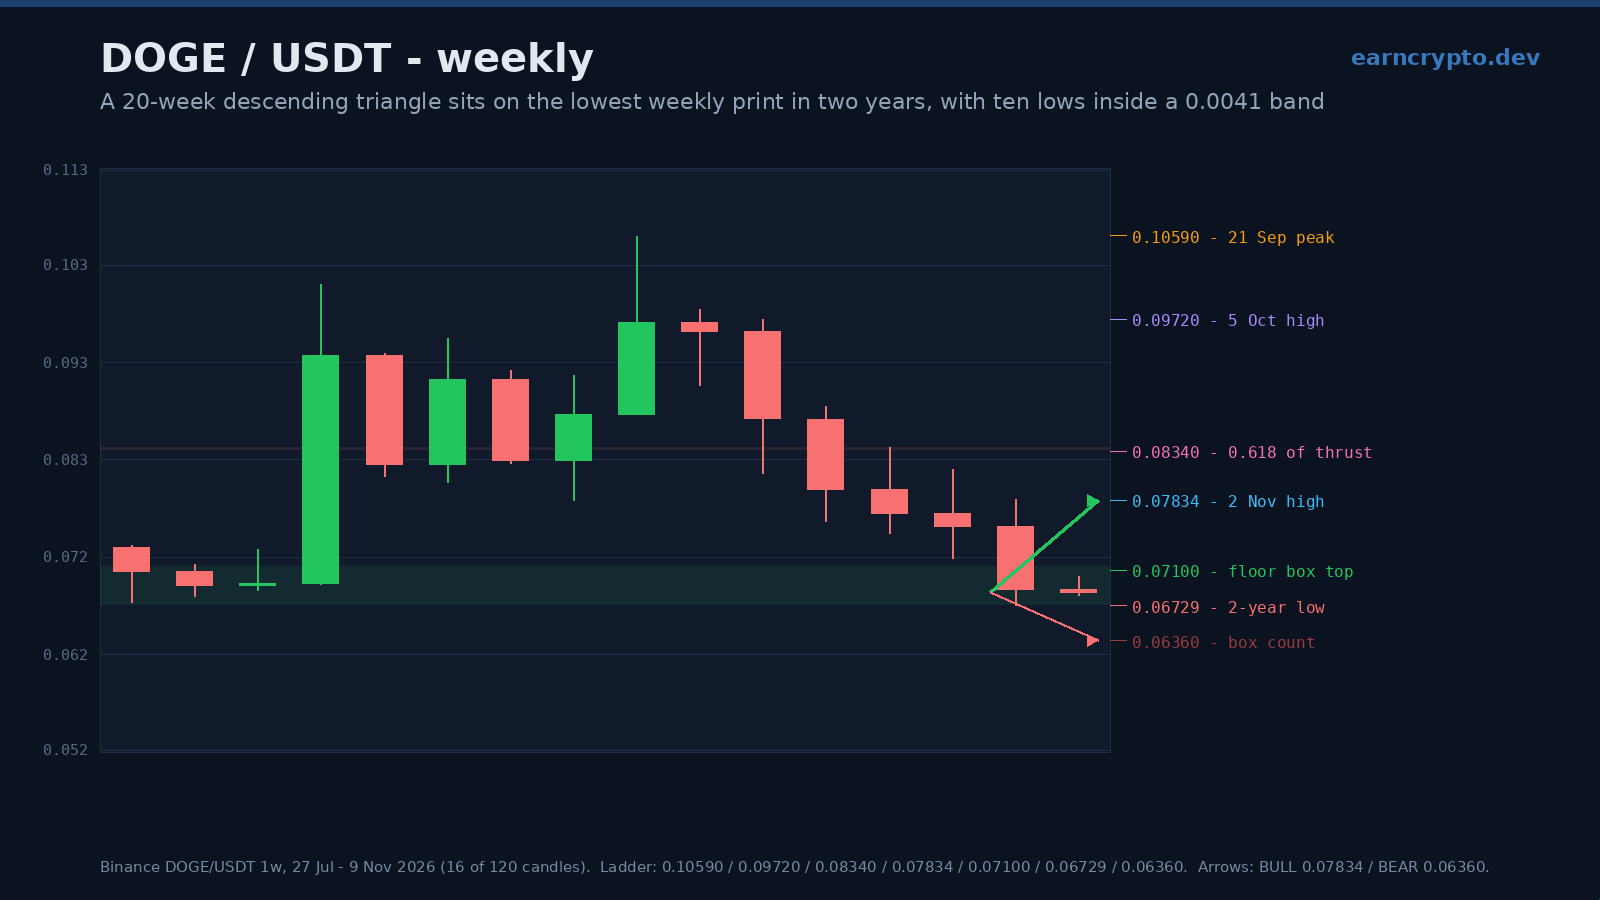
Dogecoin closed the week of 2 November at 0.06896 after printing 0.06729 — the lowest weekly print in the 120 weeks on this chart, 0.0004 under the 27 July low of 0.0677 and a fresh two-year low. The close was 2.5% above it. That recovery is the only thing the bulls own, and it is not nothing: no weekly close in the last twenty-one weeks has settled beneath 0.0673, and ten of those weeks printed a low inside a 0.0041 band between 0.0673 and 0.0714.
The week was a 16.3% range on 2.92 billion DOGE, the third consecutive week under three billion. The current candle opened at 0.06896, has traded 0.06835 to 0.07029, and sits at 0.06841 with seven hours behind it — 178 million tokens, which is what the first hours of a weekly candle look like, not a verdict.
Advertisement
The floor being tested was built in the summer
Between 22 June and 10 August the market made eight weekly lows between 0.0677 and 0.0714, on 1.87 to 3.94 billion tokens a week — the quietest tape of the entire two years. It broke upward from that base in the week of 17 August: a 0.0695 low that closed at 0.0934, a 34.2% week on 8.61 billion DOGE, 4.16 times the week before.
Five weeks later it printed 0.1059 and turned. That entire advance is now gone: the 0.786 of 0.0695-0.1059 is 0.07729, the 0.618 is 0.08340, the 0.5 is 0.08770, and the 2 November close of 0.06896 is beneath the 100% retracement at 0.06950. Whatever the August breakout was, it has been fully returned — and the price is back to the base that produced it.
Advertisement
A descending triangle that is two weeks from its apex
Since the 21 September peak the highs have done one thing without exception: 0.09819, 0.09719, 0.08814, 0.08380, 0.08148, 0.07834. Six lower weekly highs, and this week's 0.07029 is the seventh. Against them the floor has not given: 0.0677 on 27 July and 0.0673 on 2 November, fourteen weeks apart and four ten-thousandths apart, with every low between the two above it. Flat support, falling resistance.
The rails are measurable, which is what makes this a pattern rather than a description. The ceiling through the 5 October high at 0.09719 and the 2 November high at 0.07834 falls 0.0047 a week, passes above the 0.08814, 0.08380 and 0.08148 highs in between, and sits at 0.07363 for the current week. The floor is flat at 0.0673. At the September peak the triangle was 0.0386 wide; last week it was 0.0110. The two rails meet 2.3 weeks after the 2 November candle, which puts the apex in the week of 16 November. This resolves inside a fortnight or it stops being a triangle.
Descending triangles break with the trend more often than against it, and the trend since December 2024 is a 85.8% decline from 0.4843. The counterweight is the volume. The last three weeks traded 2.94, 2.89 and 2.92 billion — 44% below the 5.17 billion average of the thirteen weeks before them, and the lightest three weeks since the week before the August breakout. A floor tested on shrinking volume is one where the sellers have stopped arriving, even if the buyers have not. That is not a buy signal; it is the reason a break should be judged on a weekly close and not on a wick.
0.0710 first, then 0.0673
0.0710 is the first number that matters: the top of the floor band, the 6 July low of 0.07096, and the level every weekly close since the August breakout held — until last week's 0.06896. A weekly close back above it ends the floor test and puts the 2 November high at 0.07834 in play; a close above that is the first higher high since 21 September. Above it the 0.618 at 0.08340 and the 19 October high at 0.08380 form the first real supply the market has seen since September.
A weekly close under 0.0673 is a different chart. Two years of weekly prints sit above it, the band is 0.00370 tall, and its own count projects 0.06360 — a 7.8% move from last week's close with nothing on the chart to stop it, because the 120-week window has no print beneath 0.0673 at all. That absence of history is the whole bear case in one sentence.
The read
I put 55% on resolution lower inside a month, because that is what descending triangles do and because a two-year low is not a place where a market has already proven itself. But the bear case needs a close, not a wick: both tests of the 0.0677 and 0.0673 lows were bought, the volume on the last one was 28% of the September peak, and the apex lands in the week of 16 November — so the market has to show its hand almost immediately.
0.0673 is the floor and the ceiling comes down to meet it in two weeks. Ten weekly lows have printed inside the band since June and not one of them closed beneath it. The next one only matters if it closes under 0.0673 — until then this is a two-year low with a bid, not a bottom.
Chart: DOGE/USDT on Binance · Data: Dogecoin on CoinGecko · Reference grid: BINANCE:DOGEUSDT on TradingView. Every level on this page is drawn on the frozen 120-week weekly window.
Written by
EarnCrypto.dev Editorial
The EarnCrypto.dev editorial team researches and reviews AI mining platforms, pools and earning tools — publishing only what passes our own checks.
Related reading
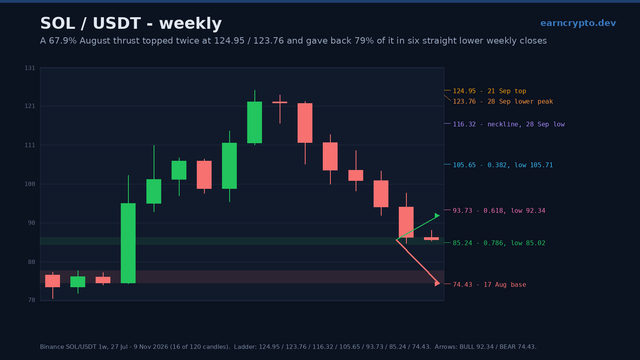
SOL Weekly Analysis — A 124.95 Double Top Has Given Back 79% of Its 50.52-Point Thrust: 85.02 Decides 92.34 or 74.43
SOL swept the 0.786 at 85.24 to 85.02 on the weekly candle and closed 1.30 back above it, after seven straight lower closes. 85.02 decides 92.34 or 74.43.
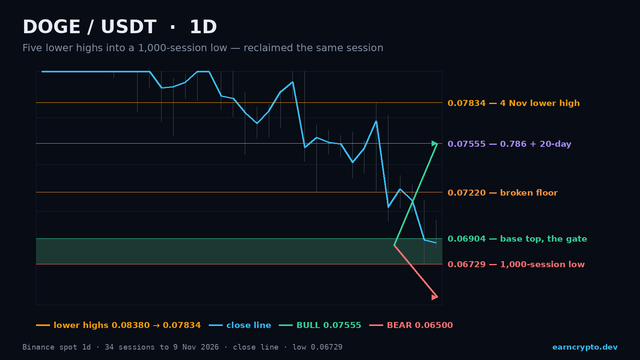
DOGE Daily Analysis — The Lowest Print in 1,000 Sessions Was Reclaimed the Same Day: 0.06904 Decides 0.07555 or 0.05624
DOGE swept 0.06729, the lowest print in 1,000 sessions, and closed back above it at 0.06896. Reclaim 0.06904 and 0.07555 opens; lose 0.06729 and 0.05624 does.
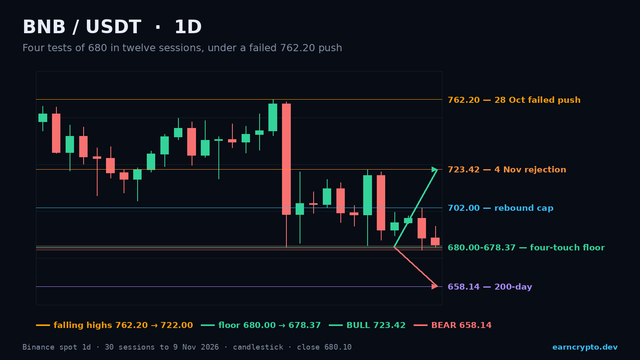
BNB Daily Analysis — A Fourth Test of 680 Under a Failed 762.20 Push: 678.37 Decides 723.42 or 635.69
BNB has printed 680 four times in twelve sessions under a failed 762.20 push. A close under 678.37 opens 635.69; reclaim 702.00 and 723.42 comes back.