
SOL Daily Analysis — Double Top at $110.6: The $97.4 Floor's Fourth Test Decides 105.9 or the 92.5 Fill
SOL daily technical analysis: lower highs under the $110.60 double top pressed the $97.4 floor again — reclaim $100 for 105.9, or lose $97.38 for 92.5.
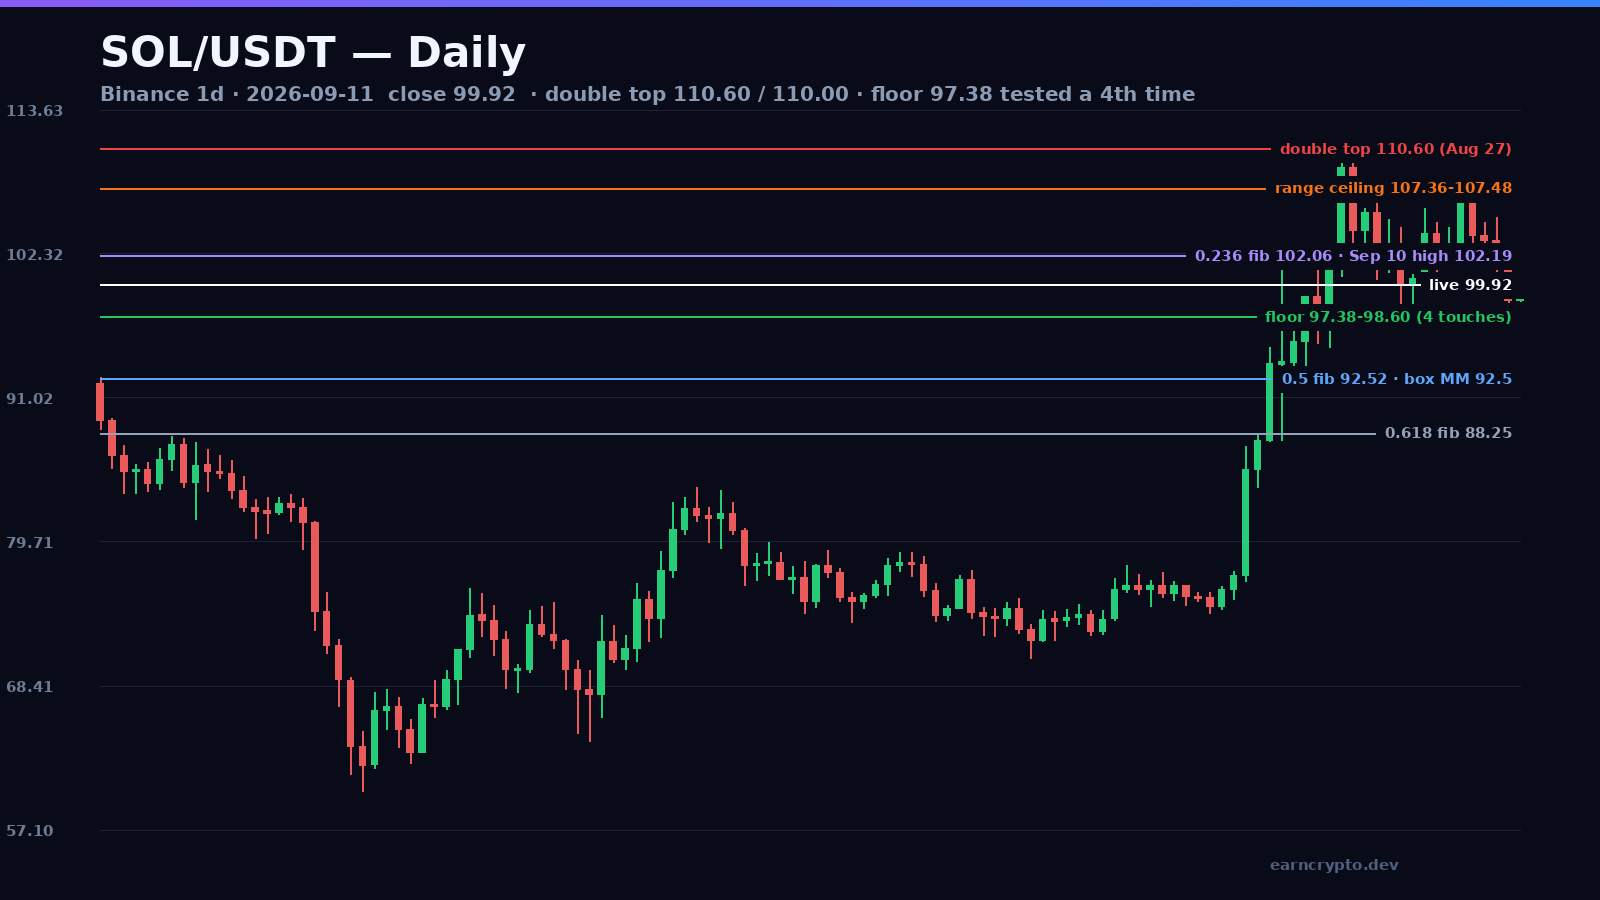
Solana's August rally ended exactly the way a top is supposed to end: a marginal new high on heavy volume, a second attempt two days later that could not follow through, and then a range. What matters now is that price has spent nine sessions inside that range and has just pressed its floor for the fourth time. The floor is $97.38-98.60. The ceiling is $107.36-107.48. Everything about the next move comes down to which one of those two lines gives first.
The double top that ended the August rally
SOL ran 47% from the August 18 low of $75.20 to the August 27 high of $110.60, and the last two candles of that run were the loudest of the month: 5.84M SOL on August 21 and 5.17M on August 27, against a September average of 2.23M. The August 27 session closed at $109.14, just 1.3% off its high. That is strength, and it deserved a follow-through.
Advertisement
It did not get one. August 28 opened at $109.15, tagged $110.00 — sixty cents below the prior high — and closed at $104.15, giving back 5.3% from the peak on 4.46M SOL. Twin highs at $110.60 and $110.00, forty-eight hours apart, the second one rejected and closed hard: that is a double top, and it has capped every candle since.
The month's real story, though, is what came after. Since August 30, SOL has not closed above $107.48 nor below $97.38 — a 10.4% box, and the quietest stretch since the August rally began.
Advertisement
Nine sessions of range, and the floor is the tell
Inside the box, the highs have been stepping down for three straight sessions: $105.20 on September 9, $102.19 on September 10 and $100.00 today. At the same time the lows have tested the same shelf four times — $98.33 on September 1, $97.38 on September 2, $98.50 on September 10 and $98.60 this morning. Four touches of one band in ten sessions, and not a single daily close below it.
That makes September 10 the interesting candle. SOL closed at $98.67 — the first close under the $100 handle since September 1 closed exactly at $100.00 — but it did it on 2.02M SOL, lighter than the September average of 2.23M and a third of the 5.17M that printed the top. A break of a round-number level on falling volume is a slip, not a liquidation, and today's session has already recovered to $100.00 intraday.
The volume profile of the whole range says the same thing: 2.86M at the heaviest September session, against 7.09M on the August 22 breakout candle and 5.17M at the top. Nobody is chasing this range in either direction. That is what compression looks like before a resolution, not what distribution looks like before a collapse.
Bull path: 100.30, then the 107.4 ceiling
The first gate is a daily close back above $100.00, which would put September 10's breakdown back in the slip category and aim at $102.06 — the 23.6% retracement of the $74.43-110.60 August impulse, and the exact high of September 10's candle at $102.19. Two levels in thirteen cents is why that zone matters.
Above it sit $105.20-105.91 (the September 9 and September 3 highs) and then the ceiling at $107.36-107.48. A daily close above $107.48 is the structural break: the box measures 10.10 points from its floor to its lid, so a confirmed break projects $117.58 — though the double top at $110.00-110.60 is the more realistic first objective, and it is 10% of upside away.
The path there will not be a straight line. Expect the $102 zone to be sold once, a retest of $100.00 from above, and a wick toward $98 before any sustained push — that is the same chop this market has produced at every level for two weeks. A daily close below $97.38 cancels the bull case outright.
Bear path: 97.38, then the 0.5 fill at 92.52
Below the floor the first target is the 38.2% retracement of the August impulse at $96.78, sitting directly under the $97.38 low — a confluence that makes a sweep of both plausible in one session. From there the 50% level at $92.52 is the magnet: the shorter measured move of the range (from the $100.00 handle to the $107.36 ceiling, 7.36 points) projects $92.64, within twelve cents of the fib.
Below $92.52 the next objective is the 61.8% retracement at $88.25, and the full box measured move of $87.28 lands just underneath it. Both sit in the $87-88.10 zone that was resistance on August 20-21 — the launch pad for the entire rally. Expect bounces along the way rather than a slide: the 4-touch floor has held every test so far, and the first close below it in a compressed range is usually chased by a reclaim attempt.
Probabilities and key levels
The lean is modestly bearish, roughly 55/45 — but with a caveat. The bear case is three lower highs in three sessions and a $100 handle that has flipped to resistance. The bull case is four touches of the same shelf without a single close below $98.33, a September 10 break on below-average volume, and SOL up 32% over thirty days with August's highs still intact as objectives.
Support: $98.33 (September 1 low), $97.38 (September 2 low, four-touch band), $96.78 (38.2% fib), $92.52 (50% fib and the range measured move), $88.25 (61.8%). Resistance: $100.00 (round-number pivot), $102.06-102.19 (23.6% fib and the September 10 high), $105.20-105.91, $107.36-107.48 (box ceiling, two touches), $110.00-110.60 (double top). Invalidations: the bull case dies on a daily close below $97.38; the bear case dies on a daily close above $107.48.
One calendar note for the projection window: the September 15-16 FOMC meeting and the September 15 CLARITY Act procedural vote both fall inside the next ten sessions. Compression into event risk usually resolves fast in whichever direction the event lands.
Watch the live order flow on Binance, the latest market data on CoinGecko, and the full interactive chart on TradingView.
Four touches of the floor, three lower highs above it. Solana has spent nine sessions deciding which line breaks — and the volume says the market is still waiting for its answer.
Written by
EarnCrypto.dev Editorial
The EarnCrypto.dev editorial team researches and reviews AI mining platforms, pools and earning tools — publishing only what passes our own checks.
Related reading

SOL Daily Analysis — Three Touches Under the $120.00 Round Number: The 114.29 Retrace Decides 126.56 or 105.05
Solana has been rejected at the $120.00 round number three sessions in a row after a 25% week. The $114.29 retrace decides whether 126.56 or 105.05 comes next.

BTC Daily Analysis — The 82,300 Box Broke: The 87,396 Double Touch Decides 90,776 or 82,648
Bitcoin broke its five-week $82,300 box on 21 September and has coiled under $87,396 since. The $84,463 retrace decides whether 90,776 or 82,648 comes next.

BNB Daily Analysis — The $780.64 Ceiling Broke: The 782.98 Retrace Decides 858 or 741
BNB cleared the $780.64 ceiling that had held since September 5 and reversed to 782.75 today, two ticks off the 782.98 retracement. The measured move is 858.