
SOL Daily Analysis — A Descending Channel Undercut by 79 Cents and a 6.4% Close Off the Low: 98.14 Decides 103.26 or 88.04
Solana undercut its five-week descending channel by 79 cents on 4 November and closed 6.4% off the low. The 97.8-98.1 gate now decides 103.26 or 88.04.
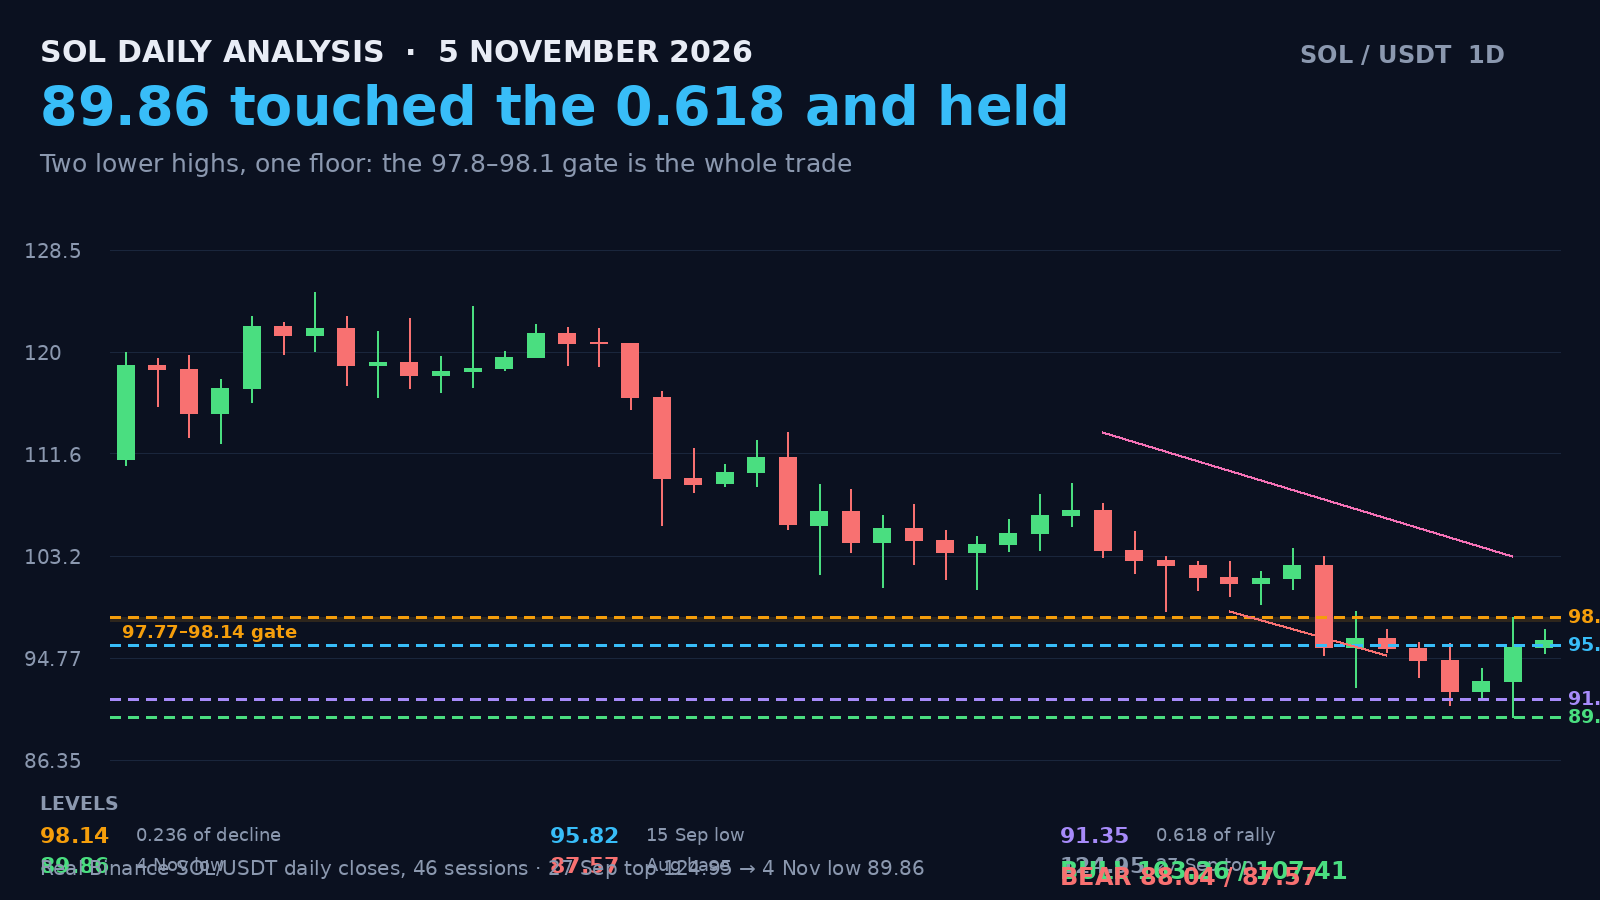
Solana closed 4 November at 95.61, 6.4% above a low of 89.86 that had taken out the 0.618 retracement of the entire August-September advance and the floor of a descending channel that has capped this market for five weeks. The candle did not just bounce. It undercut the channel rail by 79 cents, printed the lowest price since 4 August, and then closed back inside the structure on 1.83 times the twenty-day average volume — the strongest volume-and-close combination since the 29 October breakdown.
That is the whole tension in this chart. The trend is still down and the ladder of lower highs is still intact. But the last low was made on the heaviest volume of the sequence and was refused.
Advertisement
Where the sellers actually are
The top is a double top, and an unusually tight one: 124.95 on 27 September and 123.76 on 2 October, 1.19 dollars apart, with a trough at 117.26 between them. The neckline at 115.26 broke on 8 October and the measured move of 9.69 dollars pointed at 105.57. The market delivered 105.71 six sessions later and did not stop there — it kept going to 89.86, 15 points beyond the count. Overshooting a measured move is not noise; it is what happens when the last buyers are forced out rather than choosing to leave.
Since the 27 September top the highs have stepped down five times: 124.95, 123.76, 113.40, 109.20, 103.18. The lows have stepped down four: 105.41, 98.62, 95.00, 89.86. Both rails are anchored on real prints and both are drawn on the chart. Price is inside the channel and has been for thirty-nine sessions.
Advertisement
Why 97.8 to 98.1 is the trade
Three measurements land inside a 37-cent band:
- **98.14** — the 0.236 retracement of the 124.95 to 89.86 decline, which is also exactly where the 4 November high printed.
- **97.87** — the channel ceiling extended to today, anchored on the 2 October second peak and the 29 October breakdown high.
- **97.77** — the 0.5 retracement of the entire 70.58 to 124.95 advance.
A gate built from three independent anchors is worth more than one built from three looks at the same swing. Above it, the first real supply is 103.26, where the 0.382 of the decline sits 8 cents over the 29 October high — the candle that broke the 98.62 shelf. Above that, 107.41 at the halfway mark of the decline, with the 20-day average at 100.00 sitting in between as a magnet rather than a wall.
Under price, 95.82 is the 15 September low and the floor of the September consolidation. It held as support into late October and it is the first thing a bounce has to keep.
Two paths
**BULL, roughly 45%.** The 4 November rejection is the low. Price grinds through 96.60, pokes 98.45, closes 98.20, and then spends two sessions giving most of it back into 97.45 before the 20-day average at 100.00 pulls it up. From there 103.05 is a three-session affair with one red candle in the middle, and the 0.382 at 103.26 produces the first genuine rejection of the move. The full path ends near 103.90, not 107: the 107.41 half-way mark needs a weekly close over 103.26 first, and that is a story for the second half of November.
**BEAR, roughly 55%.** The channel holds. The gate rejects on the first test, 95.82 breaks on a closing basis, and the market works back to 91.80 with a bounce to 95.00 that fails. The 89.86 low is retested on lighter volume and gives way, which is normal — a level bought twice is usually sold the third time. The 10.58-dollar box from 109.20 to 98.62 projects 88.04 and the August base at 87.57 and 87.72 sits just under it, so the path ends in the high 87s rather than at a round number.
The probabilities are close to even because the evidence is genuinely split: a broken trend structure with a rejected low. What is not even is the risk. A close above 98.14 invalidates the bear case for the week; a close under 95.82 invalidates the bull case. Between those two lines, nothing is decided, and the 20-day average at 100.00 is the neutral zone where both sides get chopped.
Levels that matter
124.95 and 123.76 are the top. 103.26 is the bull objective, 107.41 the extension. 100.00 is the 20-day average. 98.14 is the gate, 95.82 the pivot under price, 91.35 the swept 0.618, 89.86 the bear trigger. 88.04 is the box count and 87.57 the August base behind it.
Written by
EarnCrypto.dev Editorial
The EarnCrypto.dev editorial team researches and reviews AI mining platforms, pools and earning tools — publishing only what passes our own checks.
Related reading
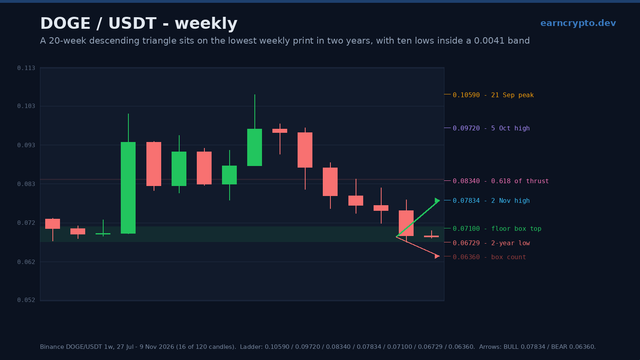
DOGE Weekly Analysis — A 20-Week Descending Triangle Is Converging on a 0.0673 Two-Year Floor: 0.0710 Decides 0.07834 or 0.0636
DOGE swept its two-year low by four ten-thousandths and closed 2.5% above it, the tenth weekly low in a 0.0673-0.0714 band. 0.0710 decides 0.07834 or 0.0636.
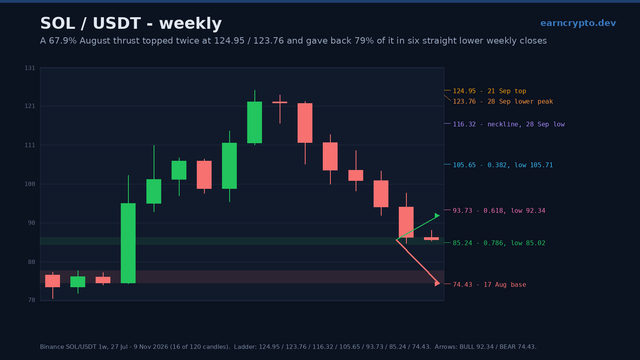
SOL Weekly Analysis — A 124.95 Double Top Has Given Back 79% of Its 50.52-Point Thrust: 85.02 Decides 92.34 or 74.43
SOL swept the 0.786 at 85.24 to 85.02 on the weekly candle and closed 1.30 back above it, after seven straight lower closes. 85.02 decides 92.34 or 74.43.
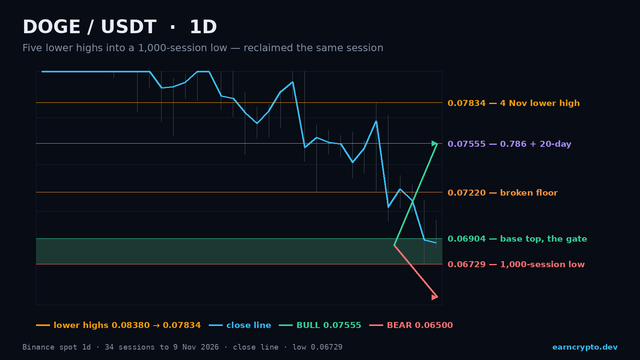
DOGE Daily Analysis — The Lowest Print in 1,000 Sessions Was Reclaimed the Same Day: 0.06904 Decides 0.07555 or 0.05624
DOGE swept 0.06729, the lowest print in 1,000 sessions, and closed back above it at 0.06896. Reclaim 0.06904 and 0.07555 opens; lose 0.06729 and 0.05624 does.