
NEAR Daily Analysis — Measured-Move Delivered at $2.64: The $2.72 Fib Decides 3.09 or 2.24
NEAR daily TA: the Sep 4 breakout delivered its $2.40-2.65 measured zone at $2.64 — the $2.72 fib now decides a run at the $3.09 June gate or a $2.24 retest.
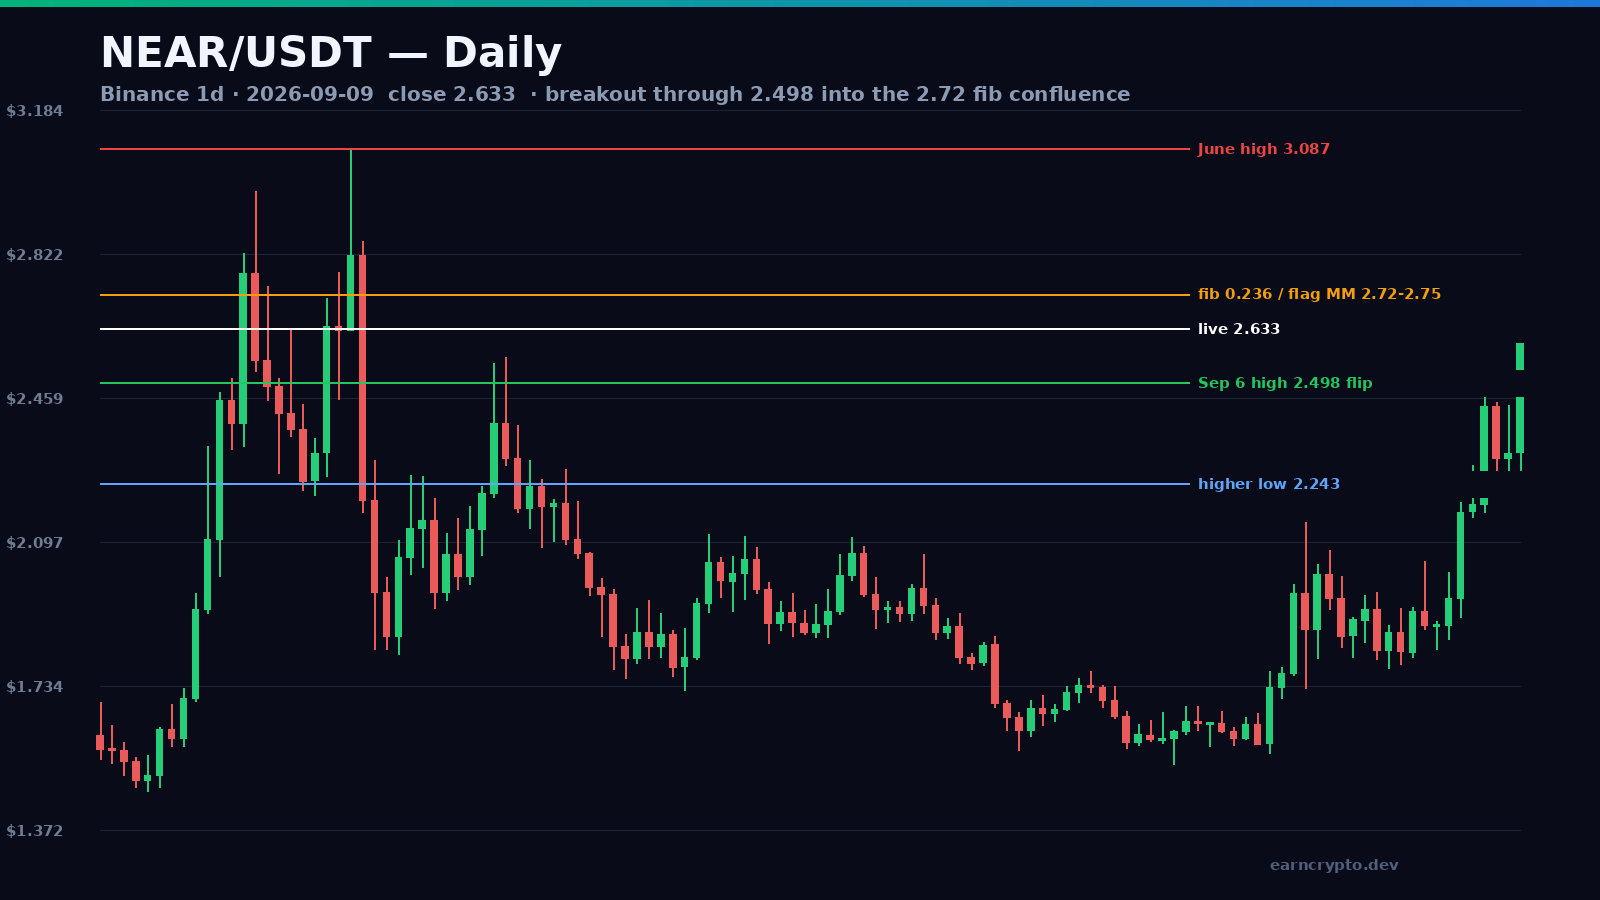
NEAR/USDT just did the thing the September 4 breakout promised: today it tagged $2.65 and closed near $2.64 — its best close since early June and a fresh three-month high that finally fills the $2.40-2.65 measured-move zone — and it did it on the heaviest volume since the August spike while most majors pulled back. The structure has graduated from base breakout to continuation, and the next level up is the last real supply before the June high at $3.087.
The base that launched the move
The foundation was a five-week accumulation base between $1.54 and $1.59 — lows at $1.571 (July 29), $1.578 (August 7), $1.538 (August 11), $1.586 (August 18) and a final $1.564 sweep on August 19 that reversed into the heaviest up-candle of the month. That reversal stalled at the August 22 spike high of $2.147 on 51M volume, and NEAR spent the next two weeks coiling under a descending lid — $2.075, then $2.047, then $2.020 — while a floor at $1.79-1.85 refused to break.
Advertisement
The breakout came on September 4, the same day NEAR Intents expanded to Aptos and Tron, putting twenty blockchains on the chain-abstraction layer. The daily candle answered with +11% on 34.9M volume, closing above the entire coil at $2.172. September 6 added the follow-through: a push to $2.498 on 37.7M, the heaviest session since August 22.
Today's candle: measured move delivered on relative strength
The pullback that followed was the tell. September 7 and 8 dipped to $2.267 and $2.243 — above the September 4 close, above the breakout gate — and each dip was bought. That shallow two-session flag (pole $2.172 to $2.498, flag low $2.243) set up today's resolution: a +13% candle to $2.65 on 35.6M volume that cleared the September 6 high and closed in the upper quarter of its range.
Advertisement
That close lands exactly inside the $2.40-2.65 destination the structure math called for when the breakout printed — the same measured zone the September 4 analysis pointed at — and it arrived on a day when the broader alt complex was mostly red. Relative strength on a pullback day is what continuation moves are made of; the open question is whether buyers can extend it through the next cluster.
The bull path: the $2.72 confluence, then the June gate
The first resistance worth respecting is a two-in-one cluster at $2.72-2.75. The 23.6% retracement of the full June-to-August decline ($3.087 to $1.538) lands at $2.722, and the bull-flag measured move — $2.498 plus the flag depth of $0.255 — lands at $2.753. A daily close above that band opens the June supply shelf at $2.82-2.85, then the May 26 high at $2.978.
Beyond that sits the real prize: the June 3 high at $3.087. The 1.618 extension of the August reversal leg ($1.538 to $2.498 = $0.96) projects to $3.09 — essentially the same number — and the level map that called the $2.30 trigger earlier this month uses $3.40 as the major resistance above it. Expect stair-steps rather than a straight line: push into supply, pull back to a rising floor, push again. A daily close below $2.243 cancels the bull path.
The bear path: a shakeout back to the breakout
The honest read on a +40% week is that the move is extended, and extended moves into supply can mean-revert violently. If today's candle turns out to be the climax rather than the continuation, the first support is the September 6 high at $2.498 — it should act as the flip level on any normal pullback. Below that sits $2.44 (the September 6 close zone), then $2.32, then the higher lows at $2.267-2.243.
Losing $2.243 on a daily close would turn today's breakout into a bull trap and drag price back through the gate at $2.197 toward the $2.00 round number, with the 61.8% retracement of the macro leg at $2.13 and the coil ceiling near $1.95 underneath. Bounces inside that path will be sharp — the same levels that have held five times tend to squeeze shorts. The bear case is invalidated on a daily close above $2.72; that is the line that confirms the flag.
Probabilities and key levels
The lean is bullish — roughly 60/40 in favor of continuation. Volume has expanded on every up-leg since August 19, the post-breakout pullback held above the breakout, the catalyst stack is real (Intents on twenty chains, Protocol Version 77, shard expansion, and an AI-agent narrative that keeps rotating capital into the layer-1 space), and total value locked sits near $218M with roughly 2,500 active developers. The counterweight is extension: NEAR is up about 40% in a week and the next stop is a zone that rejected it two months ago.
Support: $2.498 (September 6 high, first flip), $2.44, $2.32, $2.243-2.267 (higher lows — the bull invalidation zone), $2.197 (breakout gate), $2.13 (61.8% retracement). Resistance: $2.722 (23.6% retracement) with $2.753 (flag measured move), $2.82-2.85, $2.978, $3.087 (June 3 high), then $3.40. Everything between $2.243 and $2.72 is the working range; the first daily close beyond either side sets the next leg.
Track the live order book on Binance, market data on CoinGecko, the shard-expansion and Protocol Version 77 read on edgen.tech, the Intents cross-chain report on blockchain.news, and the level map that called $2.70-3.40 on Coinpedia.
A Coinpedia analysis on September 5 framed the roadmap plainly:
If buyers break and hold above $2.30, the move could extend toward 2.70, followed by the major 3.40 resistance zone.
Written by
EarnCrypto.dev Editorial
The EarnCrypto.dev editorial team researches and reviews AI mining platforms, pools and earning tools — publishing only what passes our own checks.
Related reading

SOL Daily Analysis — Three Touches Under the $120.00 Round Number: The 114.29 Retrace Decides 126.56 or 105.05
Solana has been rejected at the $120.00 round number three sessions in a row after a 25% week. The $114.29 retrace decides whether 126.56 or 105.05 comes next.

BTC Daily Analysis — The 82,300 Box Broke: The 87,396 Double Touch Decides 90,776 or 82,648
Bitcoin broke its five-week $82,300 box on 21 September and has coiled under $87,396 since. The $84,463 retrace decides whether 90,776 or 82,648 comes next.

BNB Daily Analysis — The $780.64 Ceiling Broke: The 782.98 Retrace Decides 858 or 741
BNB cleared the $780.64 ceiling that had held since September 5 and reversed to 782.75 today, two ticks off the 782.98 retracement. The measured move is 858.