
LTC Daily Analysis — A 120-Day High at $69.45: The 64.64 Retest Decides 70.77 or the 58.80 Shakeout
Litecoin broke a fifteen-week base to a 120-day high at $69.45 after a $58.80 shakeout. The 64.64 retest decides whether 70.77 or the 58.80 floor comes next.
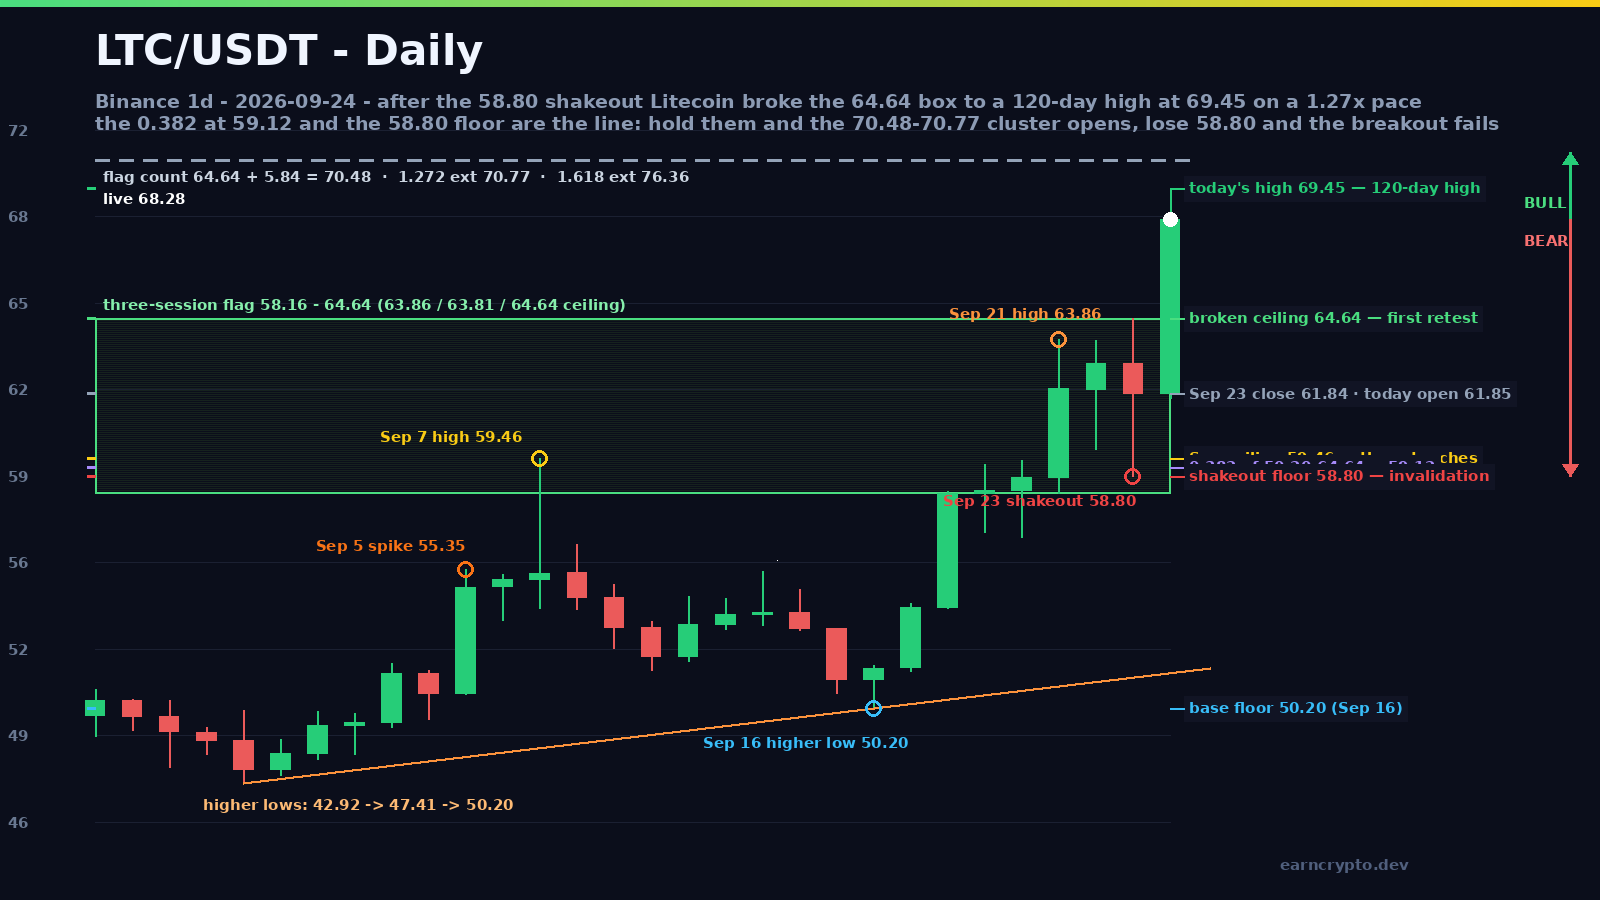
Litecoin printed a high of 69.45 today — 10.5% above the 61.85 open and the highest price in the 120 sessions on this chart. The session that produced it started life as a retest: the 23 September candle ran from 62.98 up to 64.64 and then flushed all the way to 58.80 before closing at 61.84, and today opened at 61.85, right on that close. From there it never looked back.
Fifteen Weeks of Higher Lows Under a Flat Ceiling
The base this move came out of was built on rising lows: 39.28 on 25 June, 42.92 on 13 July, 43.39 on 14 August, 47.41 on 30 August and 50.20 on 16 September. Against that floor supply sat in a narrow band — 55.45 on 22 August, then 59.46 on 7 September, a level the market touched again at 59.21 on the 19th and 59.36 on the 20th. Three touches inside 25 cents. That is a real ceiling, and it is the reason a break above it matters.
Advertisement
The 64.64 Double Top and the 58.80 Shakeout
The 59.46 shelf gave way on 21 September with a 5.60% session to 62.02 and a high of 63.86. What followed was a three-session box: 63.81 on the 22nd, five cents under the prior high, and then a 64.64 poke on the 23rd that sellers answered all the way down to 58.80. That bar carried a true range of 5.84 dollars, the widest of the three, and it filled the 0.382 retracement of the 50.20-64.64 leg at 59.12, stopping 32 cents above it before closing at 61.84. A shakeout that stops at a fib and still closes green-adjacent is not distribution — it is the last clean-out before a break. Today's 69.45 answered it.
Three Measurements, One Target Zone
The projections cluster. The 50.20-59.36 shelf is 9.16 dollars tall and projected 68.52, which today's high tagged. The June-August leg (39.28 to 55.45) is 16.17 points, and measured from the 50.20 higher low it projects 66.37 — already delivered — with the 1.272 extension at 70.77 and the 1.618 at 76.36. The 23 September range (58.80 to 64.64, 5.84 points) projects 70.48 from the breakout, or 71.12 if the box is counted from its 58.16 origin. Four methods, one band: 70.48 to 71.12.
Advertisement
What Invalidates the Break
The downside is just as specific. 64.64 is the broken ceiling and the first retest shelf; below it sit the 61.84 close and today's 61.67 low; then 59.12 — the 0.382 — and 58.80, the shakeout floor. A daily close under 58.80 would break the 0.382, undercut the 21 September low at 58.16 and turn a fifteen-week breakout into a failed move. That is the invalidation line, and it sits about 14% under today's print, which is the honest problem with a 10% session: the entry is close and the risk point is far.
RSI 80 and a 1.27x Tape
Two numbers argue for patience rather than chase. RSI(14) is 80.3, price sits 21% above its 20-day average at 56.28 and 33% above the 50-day at 51.21, and the daily ATR has widened to 3.28 dollars, 4.8% of price, with the last three true ranges running 4.03, 5.84 and 7.78. That is expansion, and expansion cuts both ways. Volume is a 1.29x pace against the 20-day average of 439,724 LTC — solid, but the 23 September shakeout traded 844,974 and the 22 August blow-off 949,623, so this leg is being bought on less tape than the August one.
A 10% session into an RSI of 80 is not a place to chase size. It is a place to let the market retest 64.64 and prove the breakout before adding.
The path of least resistance stays higher while 64.64 holds on a closing basis, and the 70.48-71.12 cluster is the first objective — but a market this extended more often digests a 10% day than extends it. Lose 58.80 and a fifteen-week structure has to be rebuilt. Watch two lines: 69.45 above, 58.80 below.
Binance LTC/USDT live chartLitecoin market data on CoinGeckoLTC/USDT chart on TradingViewWritten by
EarnCrypto.dev Editorial
The EarnCrypto.dev editorial team researches and reviews AI mining platforms, pools and earning tools — publishing only what passes our own checks.
Related reading
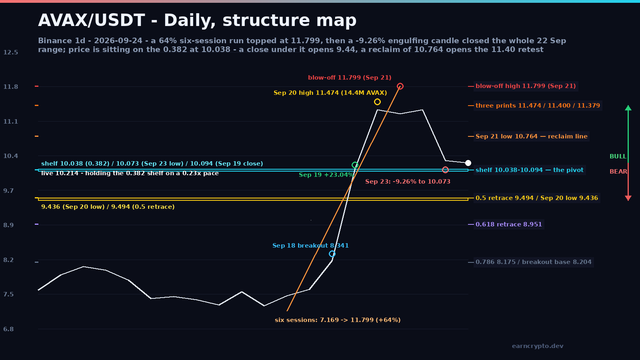
AVAX Daily Analysis — Blow-Off at $11.799 and the 0.382 Retrace: The $10.038 Shelf Decides 11.40 or 9.436
Avalanche ran 64% in six sessions to $11.799, then printed a 9.26% engulfing candle. The shelf at $10.038 decides the $11.40 retest or the slide to $9.436.

SOL Daily Analysis — Three Touches Under the $120.00 Round Number: The 114.29 Retrace Decides 126.56 or 105.05
Solana has been rejected at the $120.00 round number three sessions in a row after a 25% week. The $114.29 retrace decides whether 126.56 or 105.05 comes next.

BTC Daily Analysis — The 82,300 Box Broke: The 87,396 Double Touch Decides 90,776 or 82,648
Bitcoin broke its five-week $82,300 box on 21 September and has coiled under $87,396 since. The $84,463 retrace decides whether 90,776 or 82,648 comes next.