
INJ Daily Analysis - Retest of the $6.06 Flip: The 6.71 Spike Filled the Run, Now 6.98 or 5.34
Injective daily technical analysis: after a 70% run to 6.714, INJ is retesting the 6.057 breakout shelf - the 6.06 flip now decides 6.98 or a 5.34 refill.
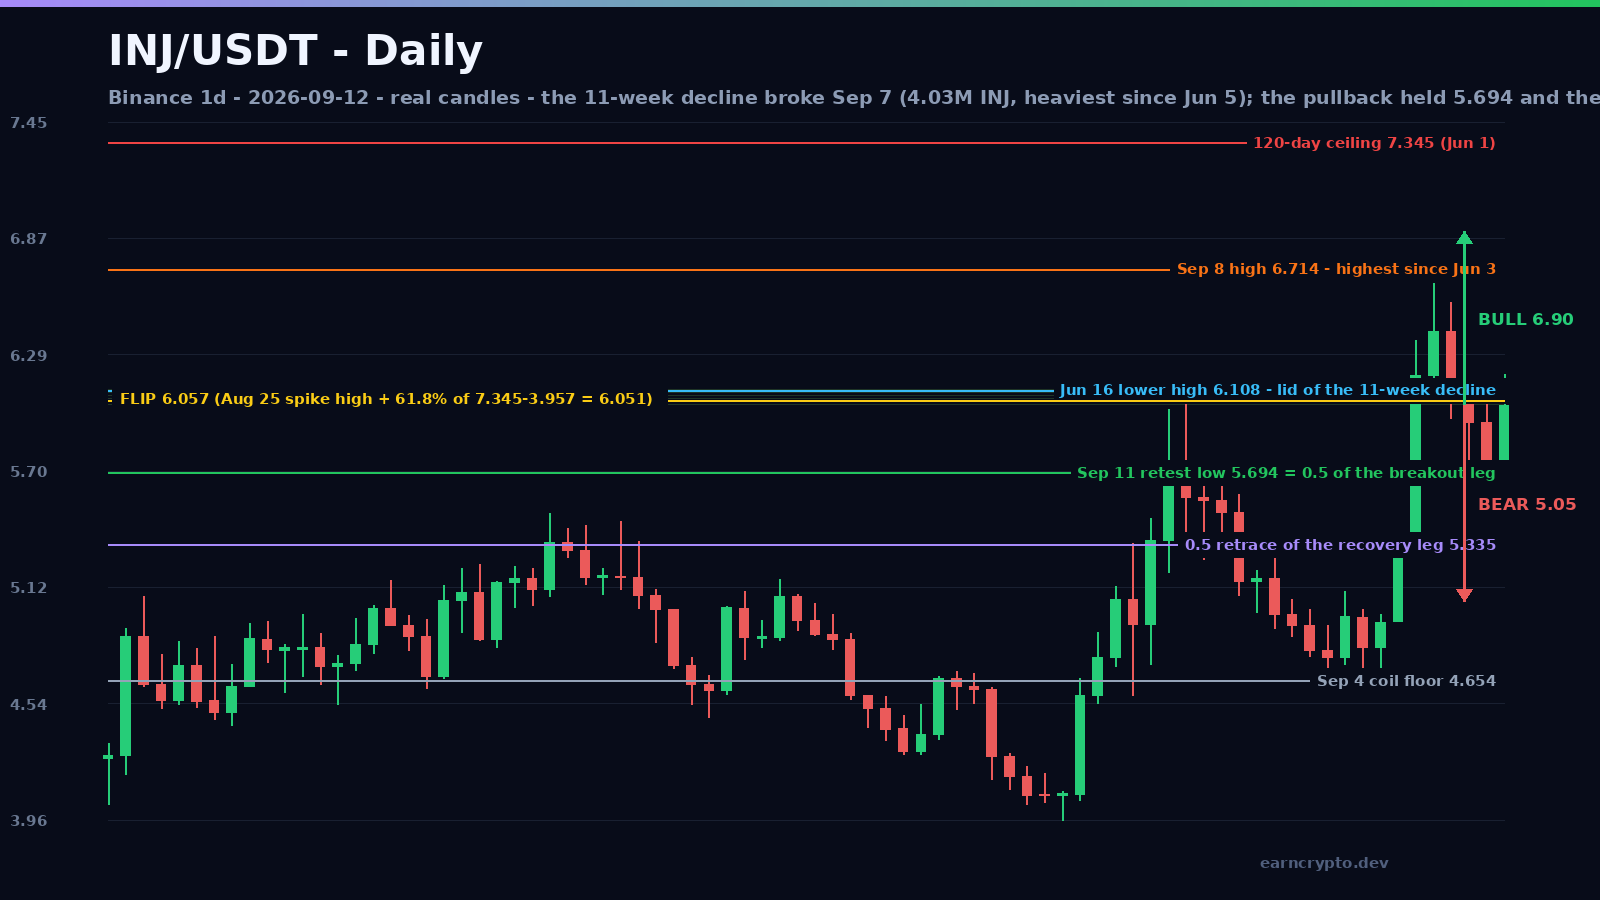
Injective printed its highest price since early June on September 8, at $6.714, capping a 70% recovery from the August 18 low of $3.957. The four sessions since have been a textbook retest rather than a reversal: price came back, gave back exactly half of the expansion, and is now leaning on the $6.05-6.11 shelf that made the whole move possible. INJ closed September 12 at $6.04, and that shelf is the line that decides what happens next.
The expansion: 4.65 to 6.71 in four sessions on the heaviest volume since June
The base was built slowly. INJ spent the back half of August compressing into a $4.65-5.10 band, and the September 4 sweep to $4.654 marked the floor of that coil. Then the range simply gave way. September 6 closed +7.4% at $5.312, and the September 7 candle ran from $5.312 to a $6.357 high before closing at $6.183 on 4.03M INJ.
Advertisement
That 4.03M print is the detail that matters: it is the heaviest daily volume since June 5 and roughly 2.3x the 20-day average of 1.74M. September 8 extended to $6.714 - the highest print since June 3 - and closed at $6.403 on another 3.67M.
What those two candles broke was an eleven-week staircase of lower highs. The decline from the June 1 high of $7.345 had printed $6.108 on June 16, $5.490 on July 20 and $5.159 on August 2 before the August 18 capitulation low at $3.957. September 7 closed above every one of them in a single session, which is why the move was not just another bounce inside a downtrend.
Advertisement
The retest: 5.694 landed one tick above the 0.5
Instead of running, INJ gave back almost exactly half. The leg from the September 4 low of $4.654 to the September 8 high of $6.714 is $2.06 deep, which puts its 50% retracement at $5.684. The September 11 low printed $5.694 - one tick above it - and the session closed back at $5.739.
Three sessions of lower highs ($6.549, then $6.156, then $6.133) into a floor that held on the first test is a pullback, not distribution. Volume did the rest of the talking: it fell from 4.03M on September 7 to 1.02M on September 12 as the retracement progressed, which is supply drying up rather than arriving.
Why $6.06 is the whole trade
The band price is fighting through right now carries three independent measurements inside six cents. The August 25 spike high that capped the August recovery sits at $6.057. The 23.6% retracement of the recovery leg from $3.957 to $6.714 lands at $6.063. And the 61.8% retracement of the entire June 1 to August 18 decline - $7.345 down to $3.957 - comes in at $6.051.
A daily close above that shelf converts it from resistance into support and reopens the expansion. Price already took out the September 10 and 11 highs with a $6.186 session high on September 12, so the first half of that work is done. Losing it would hand the tape straight back to the retracement.
The two paths: 6.98 on a reclaim, a 5.34 refill if the flip fails
Above the session high the ladder is the three spike wicks: $6.357 from September 7, $6.549 from September 9 and $6.714 from September 8. A daily close through $6.714 would be the first close above the May 29 high of $6.712 since that week, and it opens the June supply shelf - $6.759 from May 31, $6.983 from June 3, $7.069 from May 30 and the 120-day ceiling at $7.345 from June 1.
The measured move from the retest is straightforward: the pullback was $1.02 deep, and a 1.272 extension of that depth from the $5.694 low projects $6.99 - with the June 3 high sitting at $6.983. Expect a staircase rather than a ramp: a push, a pullback into $6.05-6.10, then the next push. The bull case dies on a daily close below $5.694.
The bear path is not a fresh breakdown - it is a failed retest. A daily close below $6.03 turns the September 7 expansion into a lower high and reopens the retracement ladder: $5.684-5.694 (the 0.5), then $5.661 (the 38.2% of the recovery leg), then the $5.335 shelf, which is the 50% retracement of the whole recovery and sits on the August 24-25 lows of $5.195 and $5.357.
Below that, the door opens toward $5.010 - the 61.8% of the recovery - and then the September 4 floor at $4.654, where the breakout started. Bounces inside this path should be expected, because buyers have caught every dip in the $5.30-5.40 area since August 24. The bear case is cancelled on a daily close above $6.714.
What is behind the move - and the levels that matter
The September expansion was not a chart-only event. On September 5, Coinbase switched INJ from an ERC-20 token to native support on the Injective network - direct deposits and withdrawals, prior balances converted 1:1, no migration fee and no bridge. It landed alongside Pineapple Financial's disclosure that more than $1B of residential mortgage records are already live onchain on Injective, with a plan to migrate a portfolio of 29,000+ mortgages worth $10B+, and a $100M INJ treasury staked through Kraken as primary validator.
Supply is doing part of the work too. Staked INJ reached an all-time high of 58.8 million tokens - roughly $370M, close to 60% of the 100M supply - and the token is fully unlocked, so there is no unlock overhang left to absorb. Injective Institutional Services also carries SEC transfer-agent registration and a MiCA registration in the EU, which is what makes a tokenized-mortgage pipeline legible to institutions rather than only to a crypto-native audience.
The market context: INJ trades at $6.04 with a $604M market cap, up 23% on the week and 31% on the month, and still 88% below its March 2024 high of $52.62. That combination - a real catalyst, a broken downtrend and a thin float - is what a first leg looks like when a retest is being bought rather than sold.
The lean is bullish, roughly 60/40. The breakout was volume-confirmed, the retracement landed on the 0.5 and held on the first test, and the reclaim is happening at a triple-confluence shelf rather than in open air. The honest counter is that the September 12 bounce is lighter in volume than the breakout days, so follow-through matters more than the first close.
Support: $6.03-6.06 (the flip), $5.684-5.694, $5.335, $5.010, $4.654. Resistance: $6.186, $6.357, $6.549, $6.714, $6.759-6.983, $7.069, $7.345. Invalidations: the bull case dies on a daily close below $5.694; the bear case dies on a daily close above $6.714.
Follow the live order flow on Binance, the market data on CoinGecko, and the exchange integration note on CoinMarketCap.
Eleven weeks of lower highs ended in two sessions. Now the market is deciding at 6.06 whether that was a trend change or just a September pop.
Written by
EarnCrypto.dev Editorial
The EarnCrypto.dev editorial team researches and reviews AI mining platforms, pools and earning tools — publishing only what passes our own checks.
Related reading

SOL Daily Analysis — Three Touches Under the $120.00 Round Number: The 114.29 Retrace Decides 126.56 or 105.05
Solana has been rejected at the $120.00 round number three sessions in a row after a 25% week. The $114.29 retrace decides whether 126.56 or 105.05 comes next.

BTC Daily Analysis — The 82,300 Box Broke: The 87,396 Double Touch Decides 90,776 or 82,648
Bitcoin broke its five-week $82,300 box on 21 September and has coiled under $87,396 since. The $84,463 retrace decides whether 90,776 or 82,648 comes next.

BNB Daily Analysis — The $780.64 Ceiling Broke: The 782.98 Retrace Decides 858 or 741
BNB cleared the $780.64 ceiling that had held since September 5 and reversed to 782.75 today, two ticks off the 782.98 retracement. The measured move is 858.