
GRT Daily Analysis — 7x Volume Breakout: The $0.0193 Flip Decides 0.024 or 0.016
GRT/USDT daily: Sep 6's 7x-volume breakout tagged 0.02128 at the base of June supply — the $0.0193 flip now decides a retest of 0.024 or a slide to 0.016.
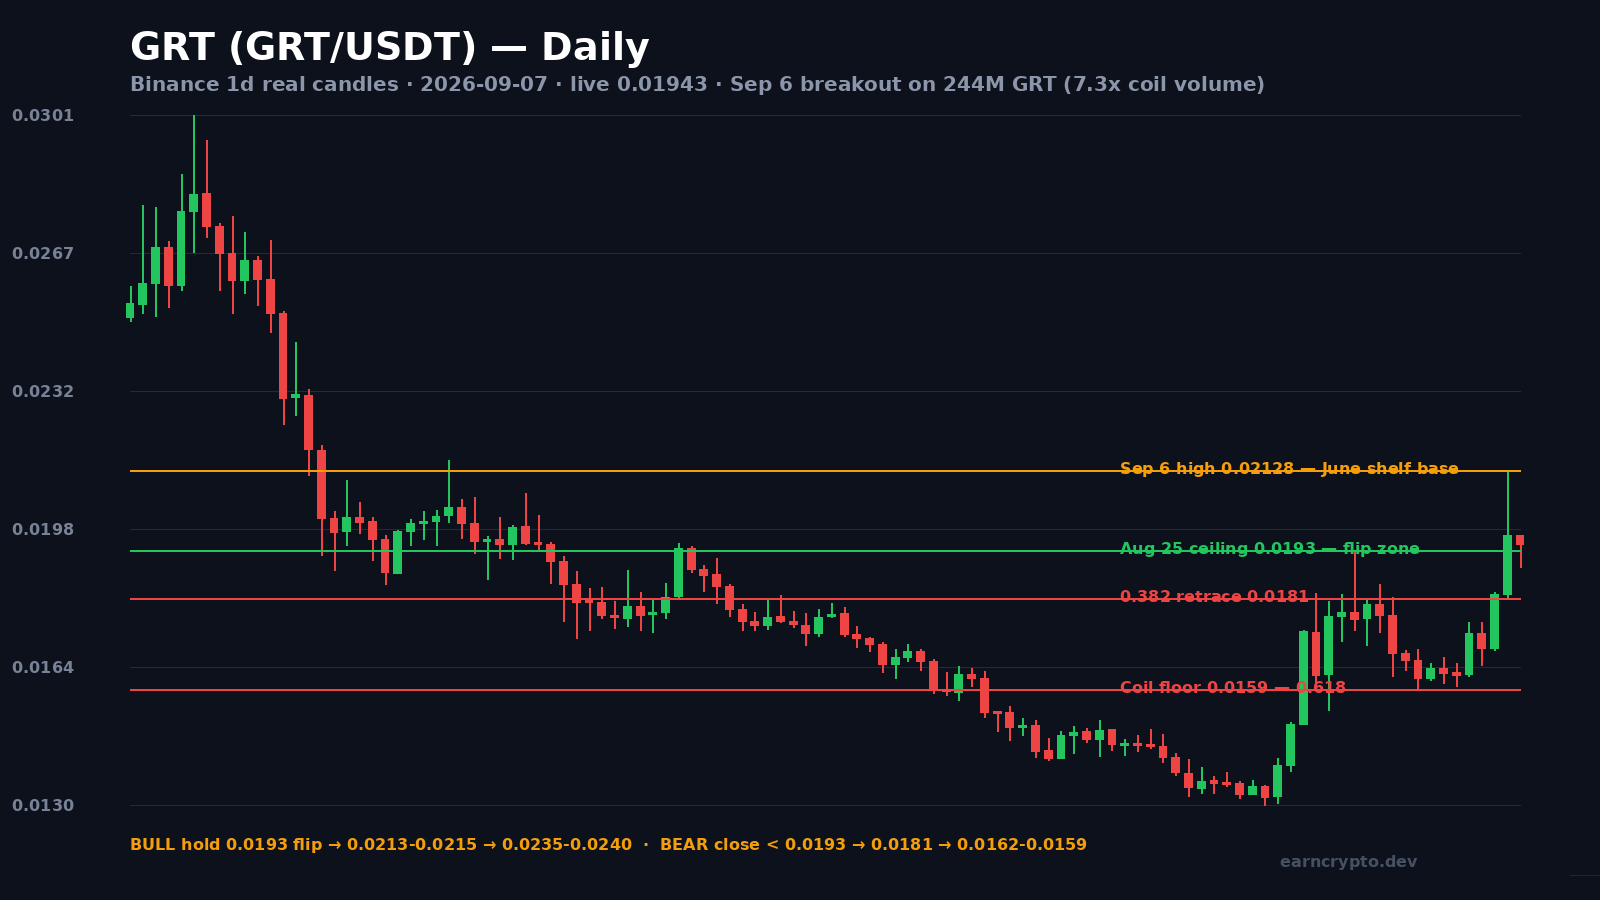
The Graph is the indexing layer that most of crypto reads through — and GRT just woke up with the loudest candle it has printed since March. After tagging a fresh all-time low of $0.01299 on August 18, the token reversed hard, coiled for two weeks, and broke out on September 6 with 244 million GRT changing hands — roughly 7.3x the coil's average volume. The breakout tagged $0.02128, the exact base of June's supply shelf, and price is now doing the healthy thing: retesting the old ceiling as support.
The Setup: Capitulation Low → V-Reversal → Volume Breakout
The August 18 low was a textbook capitulation print — the 400-day window's floor at $0.01299, minted on the same day the broader market flushed to its cycle lows. What followed was just as textbook: a 28% reversal day on August 21 (116M volume), a spike high of $0.01822 on August 22, then a two-week coil with a ceiling that kept stepping down (0.01930 → 0.01845 → 0.01825) and a floor at 0.01585–0.01592 that refused to break. That floor happens to sit exactly on the 0.618 retracement of the reversal leg — the kind of confluence that makes a floor credible.
Advertisement
The coil resolved upward on September 5 (close $0.01820, back above the descending lid), then exploded on September 6: high $0.02128, close $0.01965, on 244.4M GRT — the heaviest session since March 12 and roughly 7x the coil average. That single candle cleared the August 25 ceiling of $0.01930 and tagged the lower edge of the June supply shelf at $0.0215. It also reset the medium-term picture: GRT is no longer a downtrend making lower highs — it is a V-reversal that has reclaimed the broken structure.
The Decision: The $0.0193 Flip Zone
The number that matters now is $0.0193. It is the August 25 coil ceiling — the level breakout traders had to clear — and it is simultaneously the 0.236 retracement of the whole reversal leg (0.01299 → 0.02128), which lands at $0.01932. Two independent reasons for the same price to act as a magnet. Today's session pulled back to $0.01887 and bounced straight off the rising-lows line, closing back at $0.01943 — right on the flip.
Advertisement
The path of least resistance stays up as long as daily closes hold above $0.0193. The June shelf overhead is real but thin — only the September 6 wick has touched the $0.0213–0.0215 band in months — so a reclaim of that zone opens the next clean air pocket toward $0.0235–0.0240, where the 0.618 retracement of the May–June decline (0.02373) and the middle of June's range meet.
Volume of this size at the base of old supply isn't a random bounce — it's positioning. The question is whether buyers can hold the retest and make the shelf work as the launchpad.
BULL: Retest of the June Shelf
BULL setup (≈60/40 while the flip holds): daily closes above $0.0193 keep the structure intact. First step is a reclaim of $0.0203, then another run at $0.0213–0.0215 — expect a wick through the shelf base followed by a shakeout back to $0.0205 before the real leg extends, because that is how thin supply zones behave. A daily close above $0.0215 flips the June shelf base into support and opens $0.0235–0.0240, with the measured move of the reversal (0.01299 → 0.02128 = ~0.0083 added to the breakout) pointing at $0.0265–0.0270 in the medium term.
Invalidation: a daily close below $0.0181 (0.382 retrace, under the Aug 22 breakout high) would trap breakout longs and force a retest of the coil — the BULL thesis only dies on a daily close under the $0.0159 floor.
BEAR: Failed Breakout Back to the Coil
BEAR setup: if $0.0193 fails on a daily close, the breakout reads as a bull trap inside the June shelf. The first target is the rising-lows line at $0.01887, then the 0.382 retrace at $0.0181 — expect a dead-cat bounce there before the 0.5 retrace at $0.01713. The real battleground is the coil floor at $0.01585–0.0162 (0.618 retrace, two prior touches): a sweep of $0.01585 that closes back above would actually be a bullish liquidity grab, while a daily close below $0.0158 cancels the V-reversal entirely and opens the road back to $0.0139–$0.0130.
Invalidation: any daily close back above $0.0213 (the September 6 high) voids the bear case — that would mean the shelf base held on the first test and the breakout is continuing.
Levels to Watch
GRT sits at a rare spot for an asset down 78% over the past year: it has volume, a reclaimed structure, and a single clean decision level. Watch the daily close against $0.0193 — everything else this week is noise around that line. Data: live Binance GRT/USDT daily candles, CoinGecko market data and TradingView chart.
Written by
EarnCrypto.dev Editorial
The EarnCrypto.dev editorial team researches and reviews AI mining platforms, pools and earning tools — publishing only what passes our own checks.
Related reading
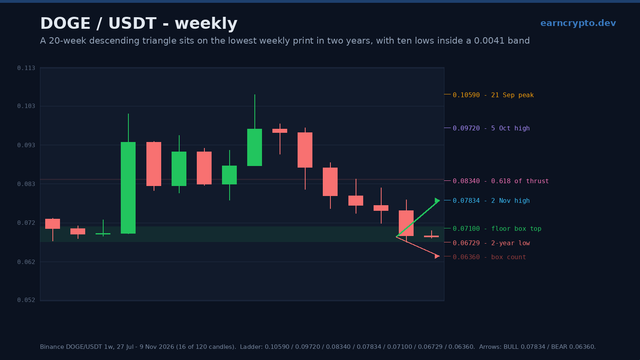
DOGE Weekly Analysis — A 20-Week Descending Triangle Is Converging on a 0.0673 Two-Year Floor: 0.0710 Decides 0.07834 or 0.0636
DOGE swept its two-year low by four ten-thousandths and closed 2.5% above it, the tenth weekly low in a 0.0673-0.0714 band. 0.0710 decides 0.07834 or 0.0636.
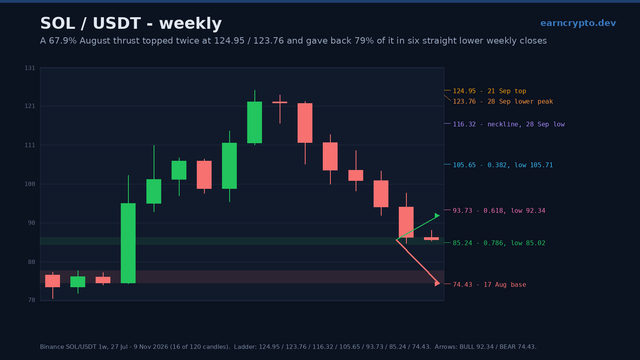
SOL Weekly Analysis — A 124.95 Double Top Has Given Back 79% of Its 50.52-Point Thrust: 85.02 Decides 92.34 or 74.43
SOL swept the 0.786 at 85.24 to 85.02 on the weekly candle and closed 1.30 back above it, after seven straight lower closes. 85.02 decides 92.34 or 74.43.
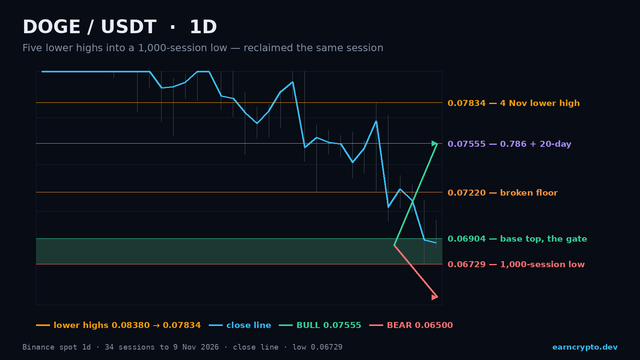
DOGE Daily Analysis — The Lowest Print in 1,000 Sessions Was Reclaimed the Same Day: 0.06904 Decides 0.07555 or 0.05624
DOGE swept 0.06729, the lowest print in 1,000 sessions, and closed back above it at 0.06896. Reclaim 0.06904 and 0.07555 opens; lose 0.06729 and 0.05624 does.