
ETH Daily Analysis — A Third Hold at 2,403 Leaves the 489-Point Downleg Capped by the 0.236 at 2,433
ETH fell 489.34 points from 2,807.34 to 2,318.00 and held the 2,403 shelf a third time. The 0.236 at 2,433.48 caps the bounce — 2,441.66 decides 2,565 or 2,318.
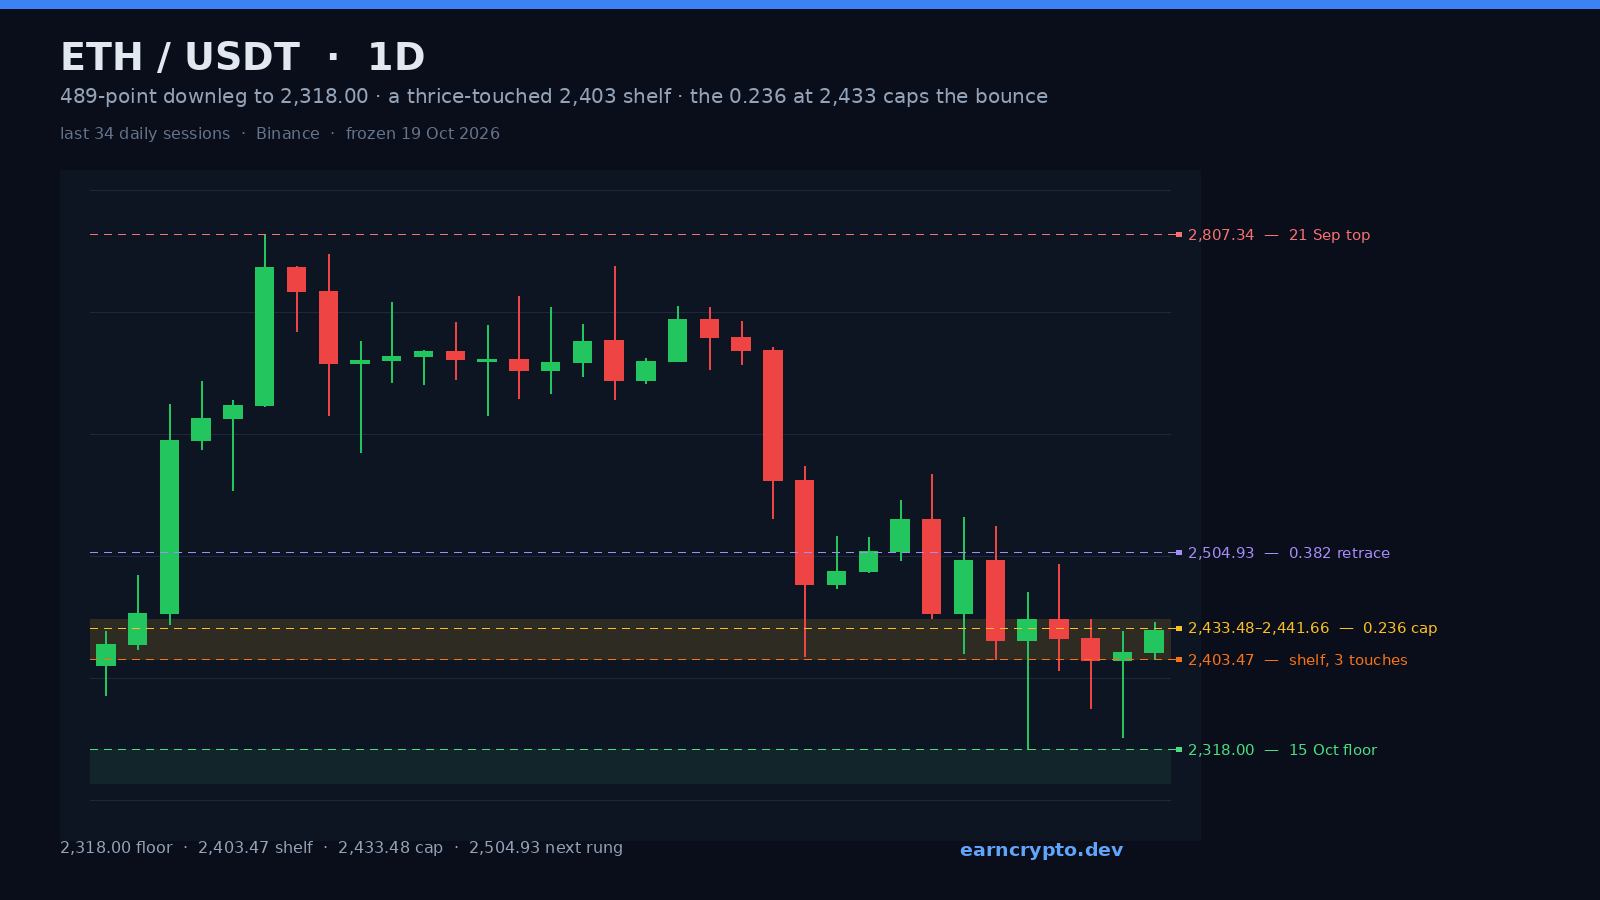
Ethereum closed 2,432.96 on 2026-10-19. The session high of 2,438.40 cleared the 0.236 retracement of its own three-week collapse by 4.92 points and the close came back 0.52 under it — the second failed attempt at that rung in three sessions. The chart worth arguing about is not the bounce. It is the shelf underneath it.
The downleg started at 2,807.34 on 21 September, printed on 573,090 ETH — 2.20x the average of the twenty sessions before it and the heaviest candle of the window. It ended at 2,318.00 on 15 October. That is 489.34 points, 17.43%, in 24 sessions, and a floor that has now been visited twice in three days.
Advertisement
The Count That Was Paid
On 12 October this column measured a 2,392.96 count off the 2,807.34 / 2,600.15 distribution and noted that it was 94% filled at 2,406.11. The market finished the job on 15 October: the candle opened 2,421.61, swept 2,318.00 and closed 2,442.08, on 446,113 ETH — 1.72x the twenty-day average and the heaviest print of the last twenty sessions. The count was overshot by 74.96 points and given straight back the same session. That shape, a sweep followed by a close near the high, is what a liquidity grab looks like when it stops finding sellers.
The 2,403 Shelf Holds a Third Time
Three prints sit inside 2.64 points: 2,406.11 on 8 October, 2,403.69 on 14 October and 2,403.47 today. The first two were the floor of the rebound. The third came from above, after the 15 October sweep, and it held on a 34.93-point range — 0.39x the 89.03 average range of the last twenty sessions. Volume says the same thing: 40,955 ETH with roughly a third of the UTC day gone, a 0.16x pace against the 260,060 twenty-day average. A shelf retested on contracting volume and held is not a shelf that is about to give way. It is also what a market looks like when nobody wants to be short into the floor.
Advertisement
Today's close of 2,432.96 sits 29.49 points over that shelf, and the 20-day mean at 2,546.95 sits 113.99 above it, so the market is trading in the empty middle of its own range.
The 0.236 at 2,433 Is the Ceiling
The retracement ladder of the 489.34-point fall puts 0.236 at 2,433.48, 0.382 at 2,504.93, 0.5 at 2,562.67 and 0.618 at 2,620.41. The session high of 2,438.40 went 4.92 through the first rung and the close is 0.52 below it. On 16 October the high of 2,494.00 stopped 10.93 under the second rung without touching it. Two rejections, one at each of the first two levels, is a distribution still being sold into strength. The bounce from 2,318.00 is 120.40 points — 24.6% of the fall, which is exactly the 0.236. A bounce that ends at its own 0.236 has not reversed anything yet.
What 2,565 Requires
Two prints three sessions apart, 11.00 points between them: 2,318.00 on 15 October and 2,329.00 on 18 October. That is a base rather than a textbook double bottom, but the count it produces is the one to watch. Neckline at the 17 October high of 2,441.66, height 123.66 points, measured move 2,565.32 — which lands 2.65 points from the 0.5 retracement at 2,562.67. That convergence is why the bull case has a number instead of a feeling. A daily close above 2,441.66 activates it, and the route is not a straight line: 2,474.80 (the 8 October close) and 2,494.00 (the 16 October high) have each already rejected once, and both sit between the trigger and the target.
What 2,318 Costs
Below today's 2,403.47 the shelf is gone and the 2,356.41 / 2,358.88 pair from 2 and 15 September is the next thing standing — both prints were broken on the way to 2,318, so neither has been defended yet. Under that, 2,329.00 and 2,318.00 are an 11-point gap, and a daily close beneath 2,318.00 invalidates the base and hands the same 123.66-point count to the downside at 2,194.34. The 100-day mean at 2,285.23 sits in between and would be the first stop, which is why the bear case is not a straight line either.
Momentum Has Not Caught Up
RSI(14) at 40.6 is neither washed out nor recovering. The 20-day at 2,546.95 has slipped 4.89 under the 50-day at 2,551.84, a fresh bearish cross in a market trading 4.56% below both. ATR(14) at 99.15 is 4.08% of spot, which means one ordinary session's range is 74% of the distance to the 2,565.32 target. Nothing in the momentum picture argues for a quiet week.
The bears have already been paid their count and the shelf has held three times. Until a close takes 2,441.66, this is a market ranging between two levels it has visited before, and both sides are waiting for the same candle.
The three numbers that matter in the next session are 2,403.47, 2,433.48 and 2,441.66. Everything above 2,441.66 belongs to the 2,565 count; everything under 2,403.47 belongs to 2,318.00 and the 100-day at 2,285.23. The 12 October note that set the 2,392.96 target is [here](/article/eth-daily-analysis-2392-count-94-filled-2635-decides-2777-or-2406), and the rest of our daily structure work runs alongside the [tools directory](/tools).
Written by
EarnCrypto.dev Editorial
The EarnCrypto.dev editorial team researches and reviews AI mining platforms, pools and earning tools — publishing only what passes our own checks.
Related reading
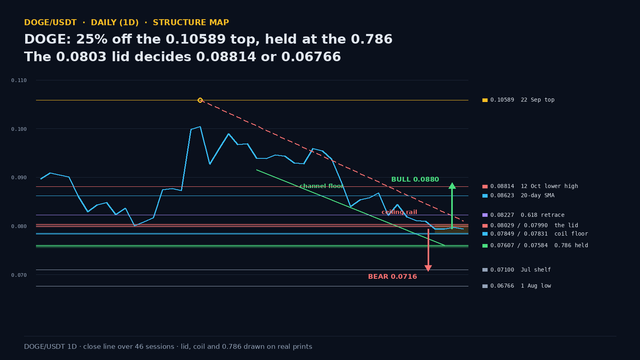
DOGE Daily Analysis — 25% Off the 0.10589 Top Held at the 0.786: The 0.0803 Lid Decides 0.08814 or 0.06766
DOGE is 25% under its 22 September top and has coiled for three sessions at 0.0800 with the 0.786 at 0.07584 intact. The 0.0803 lid decides 0.08814 or 0.06766.
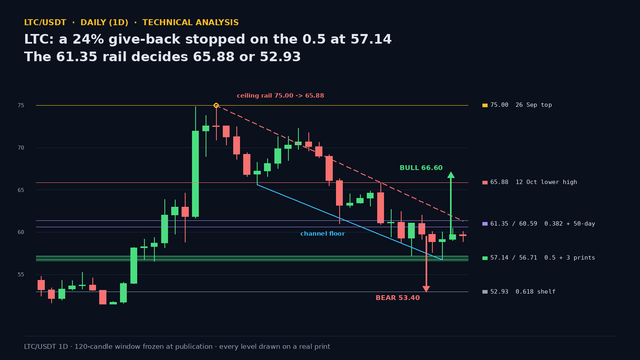
LTC Daily Analysis — A 24% Give-Back Stopped on the 0.5 at 57.14: The 61.35 Rail Decides 65.88 or 52.93
LTC's 24.4% give-back from the 75.00 top stopped on the 0.5 at 57.14 after three lower highs and three lower lows. No close has broken it. 61.35 decides.
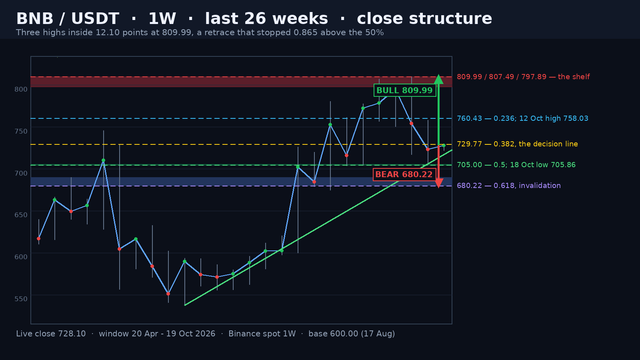
BNB Weekly Analysis — Three Highs Inside 12.10 Points at 809.99 and a Retrace That Stopped 0.865 Above the 50%: The 729.77 Line Decides 809.99 or 680.22
BNB weekly: three highs inside 12.10 points at 809.99, then a two-week retrace that stopped 0.865 above the 50%. The 729.77 line decides 809.99 or 680.22.