
BTC Daily Analysis — Floor Sweep at $76.0K: The 77,678 Fib Decides 81.5K or the 70.2K Count
Bitcoin daily technical analysis: the 76.3K August floor was swept to 76,046 and reclaimed — reclaim 77,678 for 79,890, or lose it for the 70,197 count.
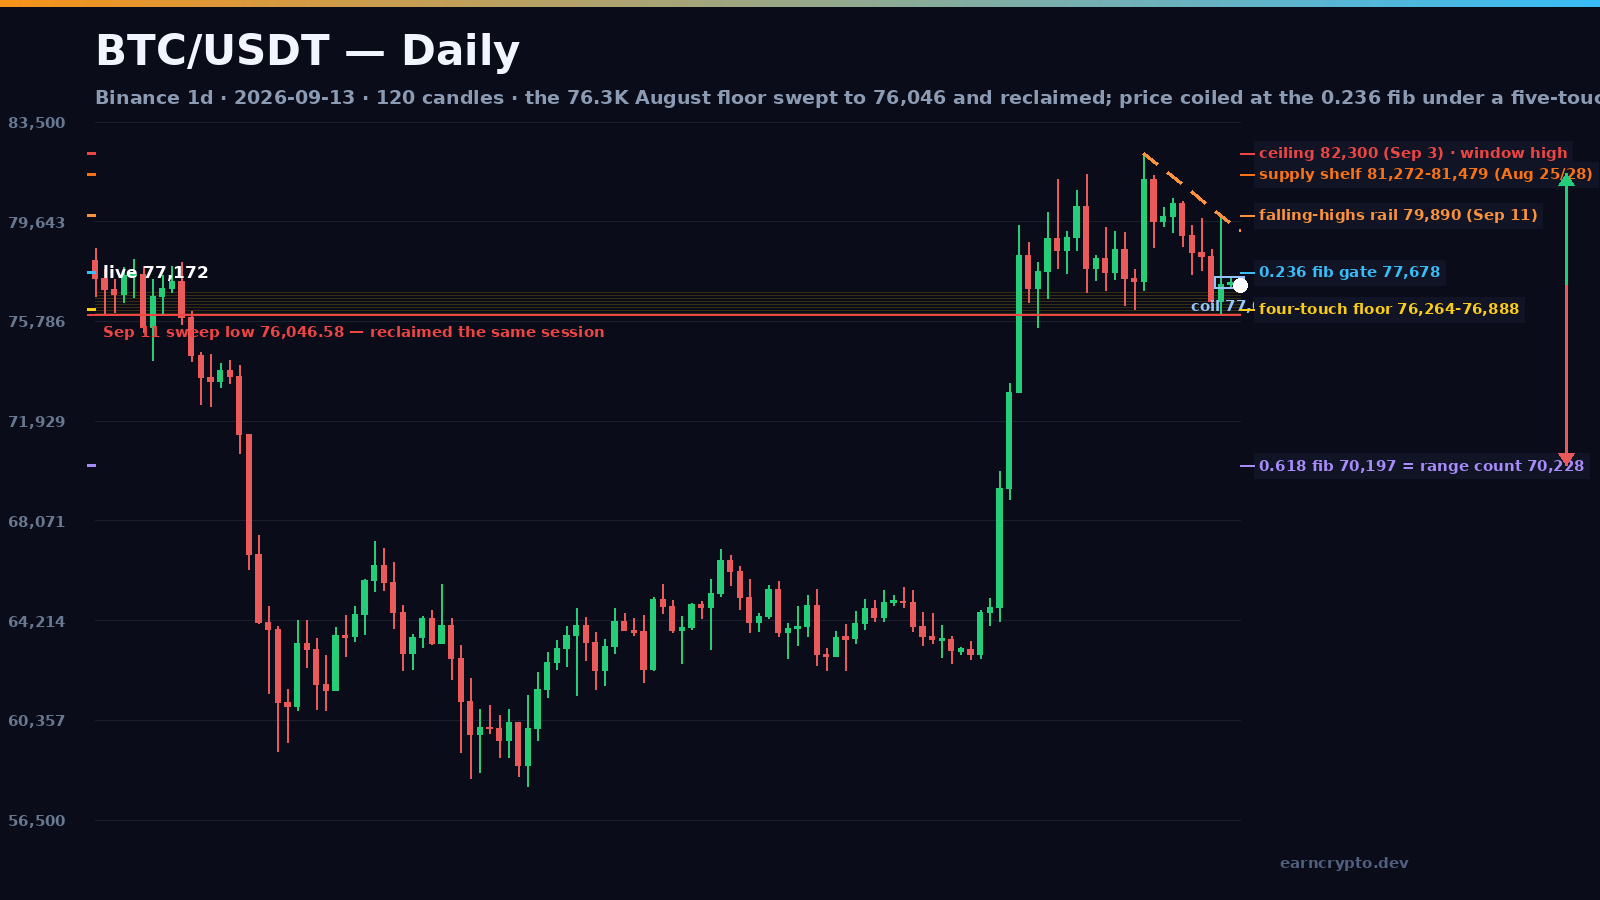
Bitcoin broke a floor that had held four times, and then pretended it had not. The $76,264-$76,888 band that stopped every pullback between August 28 and September 10 finally gave way on September 11 — $76,046.58, 217 points under its lowest touch — and the same session closed at $77,225.70, back above the entire structure. Three sessions later price is still there: today's range is $77,058-$77,341, the narrowest of the 120-session window, on 1,833 BTC, roughly a tenth of the 20-day average. What Bitcoin has built since September 3 is a falling-highs lid with a swept floor underneath it. The level that decides which of them breaks is the 0.236 retracement of the August impulse at $77,678.18.
The $82,300 spike and the supply shelf behind it
The 120-candle window opens on May 16 with Bitcoin at $78,600 and contains two markets: a nine-week decline into the July 1 low of $57,800.20 — printed on 25,093 BTC — and the August recovery that started on August 19. That recovery is what still matters. August 19 opened at $64,725.40, ran to $70,000 and closed at $69,334.80 on 29,054 BTC, 2.5x the 20-day average. August 20 closed at $73,025.10. Then August 21: the heaviest candle of the entire window, a $73,027 open, a $79,500 high and a $78,338 close on 44,340 BTC — 3.5x average.
Advertisement
August 25, August 28 and September 3 then built one supply shelf: highs of $81,272.62, $81,478.87 and $82,300 — three touches inside the same 1,027-point band. The September 3 session is the one to keep: a $77,340 open, an $82,300 high, an $81,270.40 close. A 4,960-point range that finished 1,030 points under its own high, and nothing since has come within 900 points of it. The highs have stepped down in a line instead: $81,427.80 (September 4), $80,560 (September 6), $80,444 (September 7) and $79,890 (September 11).
The floor that held four times — and the session that undercut it
While the highs fell, the lows held. August 28 stopped at $76,888, September 1 at $76,420, September 2 at $76,264 and September 10 at $76,464 — four sessions, one 624-point band. September 10 was the first daily close inside it ($76,568.70). September 11 went one step further: a $76,046.58 low, 217 points below the floor's lowest touch, then a reclaim. That session closed at $77,225.70 on 19,713 BTC, 1.3x average, and nothing since has closed below $77,058.40.
Advertisement
That is the shape of a failed breakdown — an undercut that finds buyers instead of sellers. It is not proof of anything: a spring is only a spring if the market subsequently leaves. And this market has not left, it has compressed. September 12 traded a 446-point range on 8,060 BTC, the third lightest session since August 17. Today printed 1,833 BTC, the lightest of the entire 120-candle window and less than a seventh of the 20-day average of 13,993. Collapsing volume at a swept low is what the end of a shakeout looks like — and also what the pause before a second leg lower looks like. The difference is decided at two prices, not by an indicator.
Bull case: the 0.236 at 77,678, then the rail at 79,890
The impulse that frames everything measures $62,716 (August 16 low) to $82,300 — 19,584 points. Its retracements are the board: 0.236 at $77,678.18, 0.382 at $74,818.91, 0.5 at $72,508.00 and 0.618 at $70,197.09. Bitcoin has spent three sessions pinned just under the 0.236, which is why that is the first honest gate — a daily close above it puts the market back inside the range rather than underneath it. The next obstacle is the 20-day average at $78,507.
Above that sits the supply that caused the last four lower highs: a rail through the September 3 high at $82,300 and the September 11 high at $79,890, which projects to roughly $78,140 today. A close above $79,890 would break the sequence of descending highs for the first time since September 3 and open $80,444, $80,560 and $81,427.80, with the $82,300 window high behind them. Note also where price sits relative to the medium term: the 50-day average at $71,199.80 is 7.7% below spot and still rising. That is the bulls' strongest structural argument.
Do not expect a straight line. The ATR(14) is $2,047, or 2.7% of spot — an entirely normal session covers $74,900 to $79,700 without breaking anything. A realistic bullish path tags $77,678-$78,000, gets sold back at the 20-day average, retests $77,000-$77,200 to rebuild the coil, and only then attempts the rail. Invalidation for this side of the book is a daily close below $77,058.40, the floor of the three-day coil.
Bear case: 76,046, the 0.382, and the 70,197 count
The bear case starts with a daily close below $76,046.58. That would confirm the August floor as supply rather than support, and the next level with any memory attached is the 0.382 of the impulse at $74,818.91 — 3% below spot.
Underneath it the arithmetic becomes specific. The range that has contained Bitcoin since September 3 measures $76,264 to $82,300 — 6,036 points. Projected from the floor it targets $70,228.00. The 0.618 retracement of the $62,716-$82,300 impulse is $70,197.09. Two independent measurements 31 points apart, which makes $70,197-$70,228 the real bear objective, with the 0.5 at $72,508 as the checkpoint on the way down. Bears need the close below $76,046.58 first — a 1.4% move from here that this market has spent five sessions refusing.
Probabilities and the level sheet
The lean is modestly bullish — roughly 55/45 that the 0.236 at $77,678.20 is reclaimed on a closing basis before $76,046.58 gives way — and it rests on three observations rather than on sentiment. One: the undercut was bought and reclaimed on 1.3x volume. Two: the 50-day average keeps rising, 7.7% below price. Three: the two lightest sessions of the last month are the two that printed at this coil. Against that, the sequence of highs is still falling, RSI(14) at 54.6 is neutral, and price sits 1.7% below its 20-day average. This is a market that has stopped moving — not one that has turned.
Support: $77,058.40 (coil floor), $76,464 (September 10 low), $76,264-$76,888 (four-touch August floor), $76,046.58 (September 11 sweep low), $74,818.90 (0.382 fib), $72,508 (0.5 fib), $70,197-$70,228 (0.618 fib plus the range measured move). Resistance: $77,678.20 (0.236 fib), $78,507 (20-day SMA), $79,890 (falling-highs rail), $80,444-$80,560, $81,272-$81,479 (supply shelf), $82,300 (window high). Invalidations: the bull case dies on a daily close below $76,046.58; the bear case dies on a daily close above $79,890.
Watch the live order flow on Binance, the latest market data on CoinGecko, and the full interactive chart on TradingView.
Bitcoin undercut the August floor by 217 points and bought it all back in the same session — then stopped moving entirely, on the lightest volume of the window. The 0.236 fib at $77,678 and the sweep low at $76,046.58 are the two prices that matter from here.
Written by
EarnCrypto.dev Editorial
The EarnCrypto.dev editorial team researches and reviews AI mining platforms, pools and earning tools — publishing only what passes our own checks.
Related reading

SOL Daily Analysis — Three Touches Under the $120.00 Round Number: The 114.29 Retrace Decides 126.56 or 105.05
Solana has been rejected at the $120.00 round number three sessions in a row after a 25% week. The $114.29 retrace decides whether 126.56 or 105.05 comes next.

BTC Daily Analysis — The 82,300 Box Broke: The 87,396 Double Touch Decides 90,776 or 82,648
Bitcoin broke its five-week $82,300 box on 21 September and has coiled under $87,396 since. The $84,463 retrace decides whether 90,776 or 82,648 comes next.

BNB Daily Analysis — The $780.64 Ceiling Broke: The 782.98 Retrace Decides 858 or 741
BNB cleared the $780.64 ceiling that had held since September 5 and reversed to 782.75 today, two ticks off the 782.98 retracement. The measured move is 858.