
BNB Daily Analysis — Triangle Breakout Above $741.61: The 755.61 Fib Decides 780 or 704
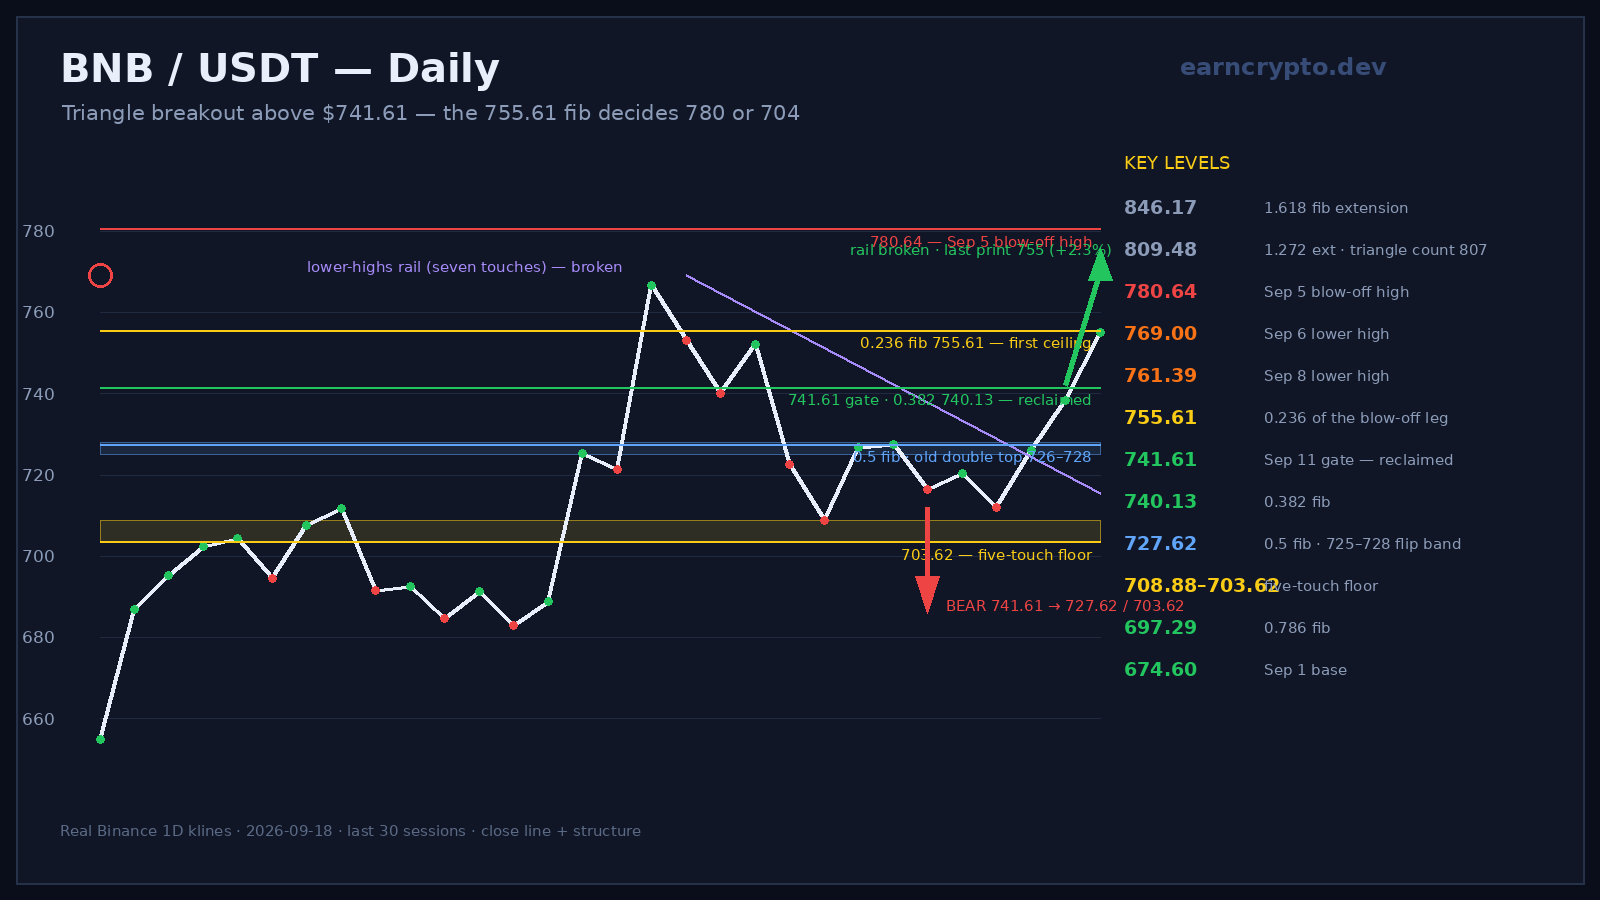
BNB broke a seven-touch falling rail and closed above the $741.61 gate for the first time since the blow-off — the 755.61 fib decides a 780.64 retest or 703.62.
The blow-off high is still the ceiling
BNB's September 5 session opened at 721.38, ran to 780.64 and closed at 766.53 on 337,494 BNB — 2.41x the twenty-day average of 139,775 and the heaviest print since August 22 (404,464). It was also a measured move: the 674.60–728.00 box that held for eleven sessions in late August projected 53.40 points above its own lid at 781.40, and the high filled it to within 76 cents.
The eleven sessions that followed produced seven lower swing highs: 769.00 (September 6), 761.39 (September 8), 757.78 (September 9), 741.61 (September 11), 739.89 (September 12), 733.75 (September 14) and 726.77 (September 16). The rail through them falls 4.4 points a session and projected 715.55 for today — every one of those highs was capped by it.
Advertisement
A flat floor under a falling rail
The lows told the other half. September 4 printed 708.88, September 10 printed 703.62, September 11 printed 706.50, September 15 printed 707.04 and September 16 printed 704.29 — five lows inside 5.26 points. The same 703.62–708.88 band was resistance in late August (highs of 707.27 on August 23, 708.39 on August 26 and 704.04 on August 30), so it is a shelf that has been tested from both sides.
Seven lower highs into a flat floor is a converging triangle. By September 16 it had compressed to 22.5 points of headroom, and those are the setups that resolve with a move rather than a drift.
Advertisement
September 17–18: the rail broke
September 17 closed at 738.36 (+1.71%) with a high of 739.49 — 19.5 points above the rail's own projection for that day. Today opened at 738.36, dipped once to 735.22 and ran to 756.32, with the last print at 755.32 (+2.30%). Volume is 67,376 BNB in 7 hours — 0.48x the twenty-day average in absolute terms, but a pace of roughly 1.6x once the partial session is normalised, which would make it the heaviest day since September 5.
The reclaimed level is 741.61 — September 11's lower high, 1.5 points from the 0.382 retracement of the blow-off leg at 740.13. That was the gate the previous daily analysis put on the bull case: a close above it ends the lower-high sequence. The last print is 13.7 points above it.
The 755.61 fib and the two counts
The blow-off leg measured 674.60 (September 1 low) to 780.64 (September 5 high) — 106.04 points. Its 0.236 retracement is 755.61, and today's high of 756.32 tagged it 0.71 points through, and the last print is 0.29 points underneath. Taking that rung back would mean the market has returned less than a quarter of the September 5 advance, and it is the last rung before the 757.78/761.39 pair and the 769.00 lower high.
The mechanical targets are close together. The nine-session box 703.62 → 741.61 is 37.99 points, and projected from the reclaimed gate it gives 779.60 — 1.04 points under the September 5 high. The wider triangle (769.00 − 703.62 = 65.38) projected from the same trigger gives 806.99, 2.5 points from the 1.272 extension of the blow-off leg at 809.48. The 1.618 extension is 846.17.
So the first target is the old high itself, and the second only becomes live once 780.64 is closed above: over it the count is 807–809, not 850.
What invalidates each case
A daily close back under 741.61 undoes the breakout. The next supports are 740.13 (the 0.382), the 0.5 at 727.62 — which is also the old 726.08/728.00 double top — the September 14 low at 713.90, and the five-touch floor at 703.62–708.88, which is the line the whole pattern is standing on. Under 703.62 the double-top count from the previous daily analysis (621–627) comes back into play, with 697.29 as the first rung.
The bear case dies on a daily close above 780.64. Between 741.61 and 780.64 this is a breakout in progress, not a trend: spot is 32.3 points over the 20-day SMA at 723.02, RSI(14) is 64.2, and ATR(14) is 23.00 — 3.0% of spot, so one ordinary session covers the whole gap. BNB is +20.4% over 30 days and +3.9% over seven, and the 50-day line sits at 668.20, 87 points below spot.
Seven lower highs into a floor touched five times inside five points, then a two-session resolution higher. The 0.236 at 755.61 is the only thing standing between the market and a full retest of the September 5 high.
The candles behind this analysis are Binance's BNB/USDT daily series; the same triangle and the same retracement ladder are on TradingView, and the live quote and market capitalisation are on CoinGecko.
Written by
EarnCrypto.dev Editorial
The EarnCrypto.dev editorial team researches and reviews AI mining platforms, pools and earning tools — publishing only what passes our own checks.
Related reading

SOL Daily Analysis — Three Touches Under the $120.00 Round Number: The 114.29 Retrace Decides 126.56 or 105.05
Solana has been rejected at the $120.00 round number three sessions in a row after a 25% week. The $114.29 retrace decides whether 126.56 or 105.05 comes next.

BTC Daily Analysis — The 82,300 Box Broke: The 87,396 Double Touch Decides 90,776 or 82,648
Bitcoin broke its five-week $82,300 box on 21 September and has coiled under $87,396 since. The $84,463 retrace decides whether 90,776 or 82,648 comes next.

BNB Daily Analysis — The $780.64 Ceiling Broke: The 782.98 Retrace Decides 858 or 741
BNB cleared the $780.64 ceiling that had held since September 5 and reversed to 782.75 today, two ticks off the 782.98 retracement. The measured move is 858.