
ARB Daily Analysis — Double-Bottom Breakout: $0.1013 Confirms, $0.132 Is the Measured Move
ARB 1d: double bottom at $0.0705/$0.0722, neckline $0.1013 broken on 10x volume — a held retest targets the $0.130-0.132 measured move, while a close below $0.094 cancels.

ARB Just Broke a Three-Month Base on 10x Volume
Arbitrum's token finally escaped the box it had been trapped in all summer. On Monday, ARB closed at $0.1094 — up 30% on roughly 10 times its average daily volume — and today it followed through to a $0.1202 high before settling near $0.1116. The breakout ended a consolidation that ran from early June, when price bottomed at $0.0705, through two and a half months of grinding between $0.072 and $0.10. Live data shows ARB at $0.1115 with a $742M market cap and a 31% gain over the past 24 hours.
The catalyst mix is real. Robinhood Chain — built on Arbitrum's tech stack — set an all-time daily DEX volume record of $874.8M on August 30 and briefly out-earned Ethereum in 24-hour application revenue. The ArbOS 61 "Elara" upgrade activated August 20 boosted Stylus contract capacity and added optional compliance filtering, and an upcoming $100M ecosystem initiative was announced for the fall. Volume, upgrades and capital are lining up in the same direction — that is what a durable breakout looks like in the making.
Advertisement
The Double-Bottom Structure in Real Levels
Strip away the noise and the daily chart is unusually clean. The left low printed on June 25 at $0.0705, the middle peak on July 12 at $0.1013, and the right low on August 16 at $0.0722 — a textbook double bottom whose neckline sits exactly at the July peak. Monday's close above $0.1013 on tenfold volume is the confirmation; today's push to $0.1202 is the follow-through that separates a real move from a liquidity grab.
The measured move does the math for us: neckline $0.1013 plus the pattern depth of 0.0308 (0.1013 − 0.0705) targets $0.132. The Fibonacci retracement of the May high to June low lines up underneath — 0.382 lands at $0.1007 (right on the neckline), 0.5 at $0.1100, and 0.618 at $0.1193, which today's high tagged to the pip. The 0.786 extension at $0.1326 stacks on the measured move, making $0.130-0.135 the zone where this move either delivers or stalls.
Advertisement
Two Scenarios: Continuation vs. Failed Breakout
Path of least resistance remains upward after a volume breakout, but the first retest usually decides the quality of the move. Expect choppy action around $0.109-0.113, not a straight line.
BULL (higher probability): ARB holds the $0.109-0.113 breakout zone on a retest, then stair-steps through $0.121 (0.618) and $0.126 toward the $0.130-0.135 measured-move shelf. Pullbacks into rising support — the $0.117 area and the $0.109 neckline retest — are the healthy rhythm, with wicks up to $0.135 as profit-taking tags.
BEAR: the breakout gets sold. ARB fails to hold $0.109 on a daily close, retests the $0.1013 neckline, and a break below it sweeps back into the range — $0.095 (August 23 low) and $0.087 become the magnets, with the August 30 low at $0.0831 as the liquidation-sweep zone that would flush the breakout chasers before any resumption.
A close above $0.1013 on 10x volume is ARB's first real breakout of the year. The retest decides whether it becomes a trend or a trap — today's 0.618 tag at $0.1202 is a healthy first step, not the finish line.
What Invalidates Each Path
BULL is invalidated by a daily close below $0.094 — that puts price back inside the range and loses the breakout structure entirely. BEAR is invalidated by a daily close above $0.121, which would confirm momentum continuation through the 0.618 rather than a bull trap. Between the two, the $0.109-0.113 zone is the battleground for the next 24-48 hours.
One dated event sits ahead: a scheduled unlock of 92.6M ARB on September 16, roughly $10M at current prices against a $742M market cap — a manageable overhang, but worth watching for a volatility window. Track the live tape on CoinGecko and the order flow on Binance ARB/USDT.
Written by
EarnCrypto.dev Editorial
The EarnCrypto.dev editorial team researches and reviews AI mining platforms, pools and earning tools — publishing only what passes our own checks.
Related reading
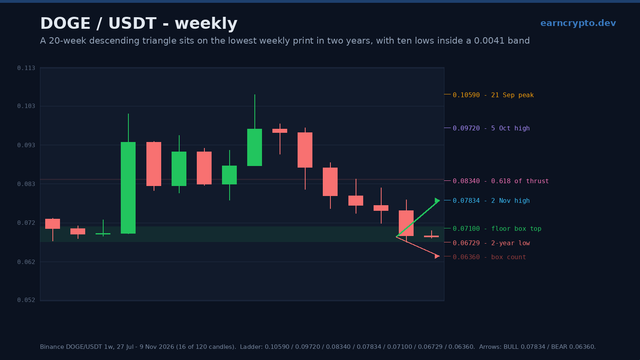
DOGE Weekly Analysis — A 20-Week Descending Triangle Is Converging on a 0.0673 Two-Year Floor: 0.0710 Decides 0.07834 or 0.0636
DOGE swept its two-year low by four ten-thousandths and closed 2.5% above it, the tenth weekly low in a 0.0673-0.0714 band. 0.0710 decides 0.07834 or 0.0636.
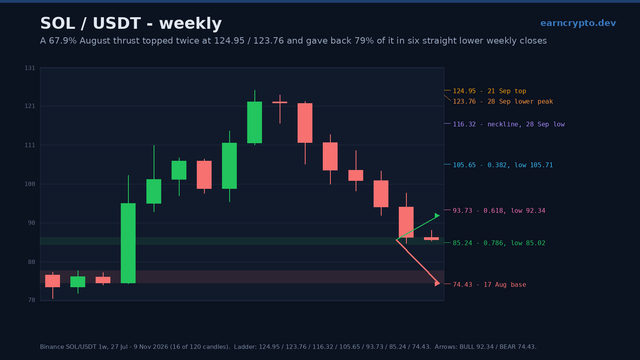
SOL Weekly Analysis — A 124.95 Double Top Has Given Back 79% of Its 50.52-Point Thrust: 85.02 Decides 92.34 or 74.43
SOL swept the 0.786 at 85.24 to 85.02 on the weekly candle and closed 1.30 back above it, after seven straight lower closes. 85.02 decides 92.34 or 74.43.
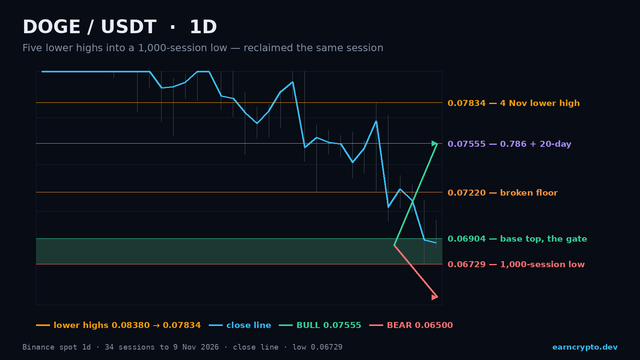
DOGE Daily Analysis — The Lowest Print in 1,000 Sessions Was Reclaimed the Same Day: 0.06904 Decides 0.07555 or 0.05624
DOGE swept 0.06729, the lowest print in 1,000 sessions, and closed back above it at 0.06896. Reclaim 0.06904 and 0.07555 opens; lose 0.06729 and 0.05624 does.