
ADA Daily Analysis — Two Tests of the 0.786 and a Failed Reclaim of 0.2015: The 0.2057 Gate Decides 0.2204 or 0.1712
Cardano tested the 0.786 twice in six sessions, swept 0.2015 and closed back at 0.1973 on 1.56x volume. The 0.2057 gate now decides 0.2204 or a 0.1712 flush.
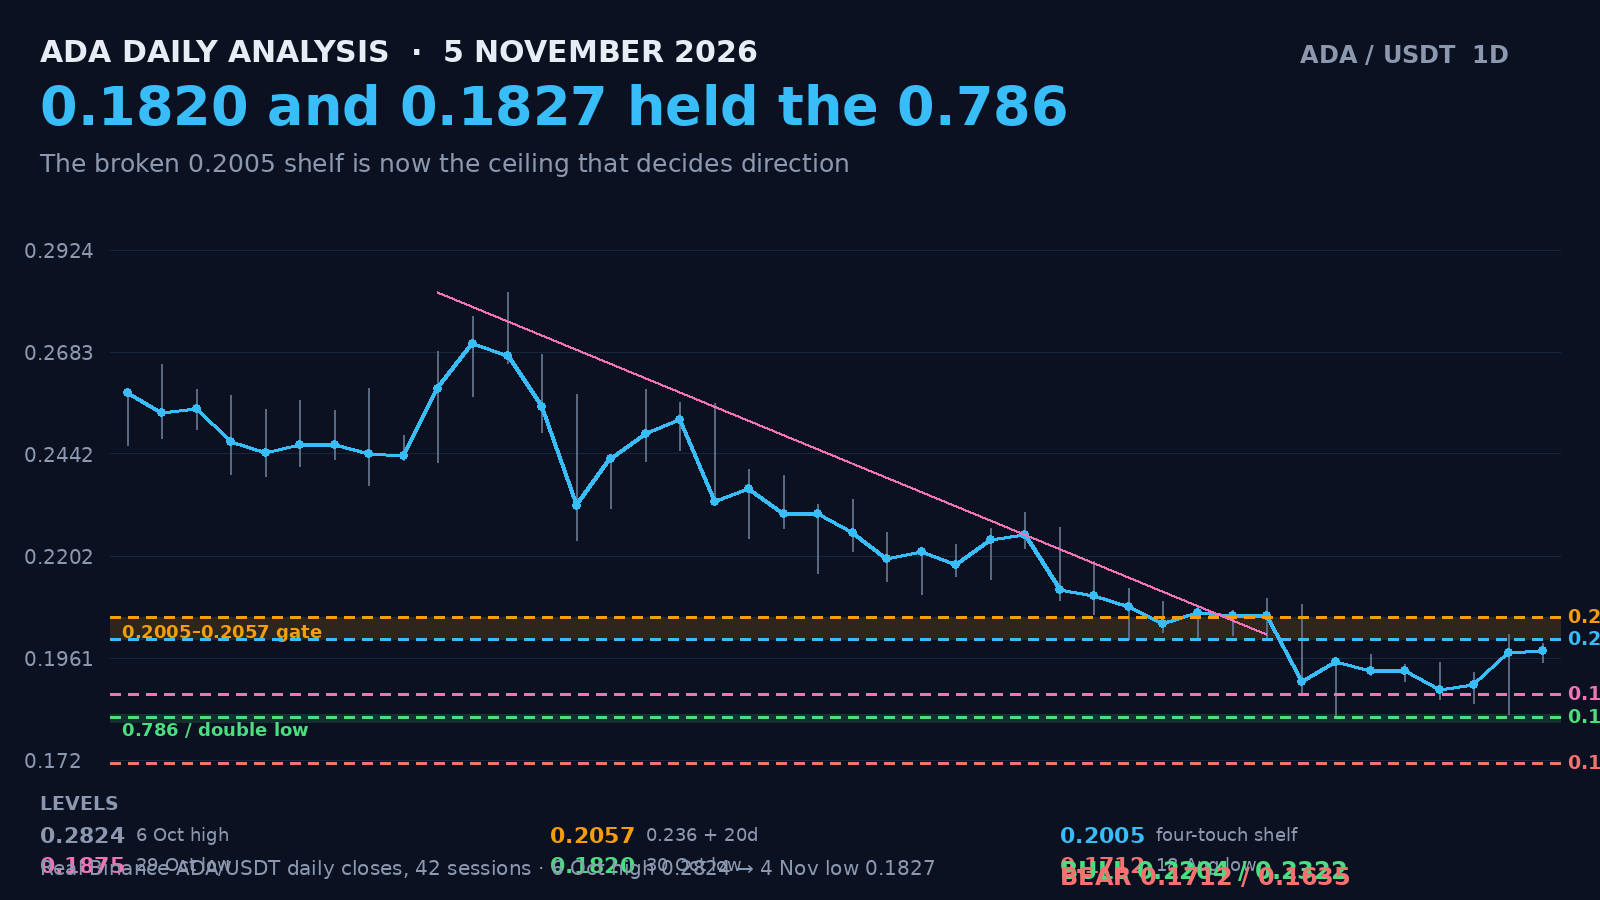
Cardano closed 4 November at 0.1973 after a session that did everything: it swept down to 0.1827 — a second test of the 0.786 retracement, seven ticks above the 30 October low — then rallied 0.2015, poking ten ticks through the broken 0.2005 shelf, and settled below it. The range was 10% of the price and the volume was 121 million tokens, 1.56 times the twenty-day average and more than the session that made the low it was testing.
Two things happened in that candle and only one of them is bullish. The 0.786 held on a second, higher test on heavier volume. The broken shelf refused to be reclaimed.
Advertisement
The shelf is the story
Between 24 and 28 October ADA printed four lows inside 8 ticks: 0.2005, 0.2005, 0.2013, 0.2007. Four touches is the strongest form of horizontal support a daily chart produces, and it broke on 29 October on 201.9 million tokens — 2.27 times the preceding average — with a close at 0.1904, 5% under the shelf. The following session flushed to 0.1820, 11 ticks under the 0.786 of the entire 0.1533 to 0.2824 advance, and closed 7.3% off that low.
That is the sequence that defines this chart: a shelf that held four times, failed on volume, and a 0.786 that caught the flush. Everything since 30 October is a fight over which of those two facts matters more.
Advertisement
What the last four sessions added
29 October broke the shelf. 30 October made the low. 31 October to 3 November drifted lower on shrinking volume — 32, 38, 65 and 51 million tokens against a 72 million average — with lower highs at 0.1970, 0.1945, 0.1949, 0.1926. That is a market with no seller left in size, not a market being distributed.
Then 4 November: 0.1827 low, 0.2015 high, 0.1973 close on 121 million. The falling-highs rail anchored on the 21 October high of 0.2269 and the 28 October high of 0.2101 projected 0.1905 for that session. Price closed 0.0068 above it — the first close above that sequence's rail in fifteen sessions.
The gate is 0.2057, not 0.2005
The temptation is to treat 0.2005 as the level. It is not, and the 4 November wick is the proof: price traded through it and closed 32 ticks below.
The gate is **0.2057**, where the 0.236 retracement of the 0.2824 to 0.1820 decline sits 3 ticks over the 20-day average at 0.2054. Nothing has closed above that average since 6 October. A daily close over 0.2057 changes the character of the chart; a wick through 0.2005 does not.
Above the gate the ladder is thin: 0.2101 (28 October high), then 0.2204 at the 0.382 of the decline, then 0.2322 at the halfway mark. Below, 0.1875 is the 29 October low, 0.1820 and 0.1827 are the double bottom, 0.1712 is the August floor and 0.1635 is the 0.0185 box count.
Two paths
**BULL, roughly 50%.** The double bottom is real. Price pulls back to 0.1962, retests 0.2000, closes 0.2008, and then two sessions grind between 0.2005 and 0.2050 as the shelf turns from ceiling into floor. The 20-day average at 0.2054 rejects the first attempt at 0.2050; the second close is 0.2052 and the third 0.2090. From 0.2101 the path slows — one red candle at 0.2074 before 0.2118 — because 0.2204 is a two-week target, not a two-day one.
**BEAR, roughly 50%.** The gate holds. 0.1980 fails, 0.1950 gives way, and price slides back to 0.1912 with a bounce to 0.1958 that dies. The 0.1875 low breaks, 0.1824 is tested on lighter volume and gives way on the third visit, which is the normal fate of a floor bought twice. The 0.0185 box projects 0.1635, and the August floor at 0.1712 sits in front of it, so the realistic bear destination is 0.1720 — not 0.1635, which needs a broader market break.
Probabilities are even because the structure is even: a confirmed higher low inside a downtrend whose 20-day average is still 3.8% overhead and falling. A daily close above 0.2057 invalidates the bear case; a daily close below 0.1820 invalidates the double bottom. Between 0.1820 and 0.2057 the market is simply unresolved, and 22% of the recent range sits in that band.
Levels that matter
0.2824 is the top. 0.2204 and 0.2322 are the bull objectives. 0.2057 is the gate, 0.2015 and 0.2005 the broken shelf above price, 0.1970 the double-bottom neckline. 0.1875 is first support, 0.1820 and 0.1827 the double low over the 0.786 at 0.1809. 0.1712 is the bear objective and 0.1635 the box count behind it.
Written by
EarnCrypto.dev Editorial
The EarnCrypto.dev editorial team researches and reviews AI mining platforms, pools and earning tools — publishing only what passes our own checks.
Related reading
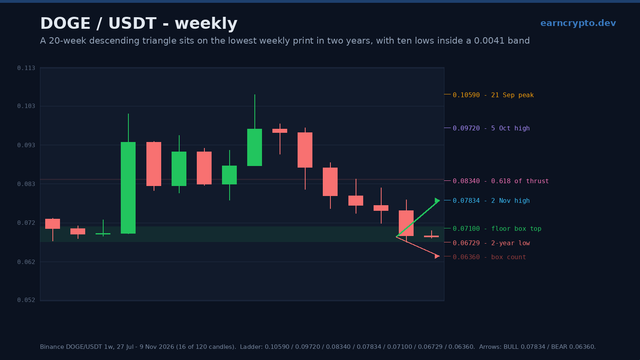
DOGE Weekly Analysis — A 20-Week Descending Triangle Is Converging on a 0.0673 Two-Year Floor: 0.0710 Decides 0.07834 or 0.0636
DOGE swept its two-year low by four ten-thousandths and closed 2.5% above it, the tenth weekly low in a 0.0673-0.0714 band. 0.0710 decides 0.07834 or 0.0636.
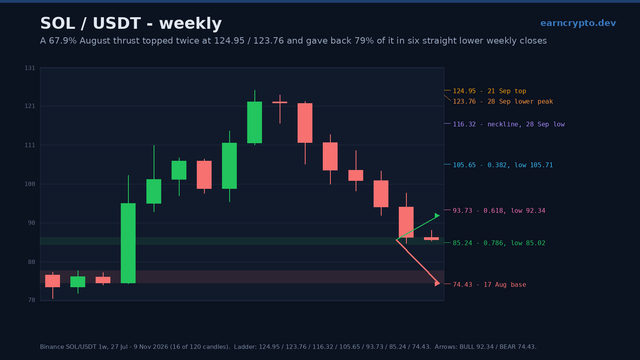
SOL Weekly Analysis — A 124.95 Double Top Has Given Back 79% of Its 50.52-Point Thrust: 85.02 Decides 92.34 or 74.43
SOL swept the 0.786 at 85.24 to 85.02 on the weekly candle and closed 1.30 back above it, after seven straight lower closes. 85.02 decides 92.34 or 74.43.
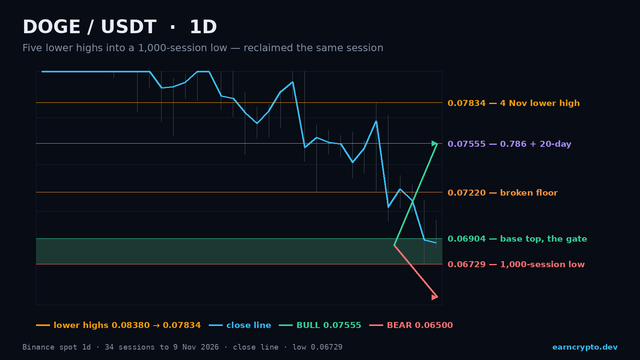
DOGE Daily Analysis — The Lowest Print in 1,000 Sessions Was Reclaimed the Same Day: 0.06904 Decides 0.07555 or 0.05624
DOGE swept 0.06729, the lowest print in 1,000 sessions, and closed back above it at 0.06896. Reclaim 0.06904 and 0.07555 opens; lose 0.06729 and 0.05624 does.