
ADA Daily Analysis — Nine Lower Highs in Ten Sessions Held on the 0.382: The 0.2273 Line Decides 0.2484 or 0.2103
ADA printed nine lower highs in the ten sessions after its 0.2824 peak, yet five wicks under the 0.382 all closed back above: 0.2273 decides 0.2484 or 0.2103.
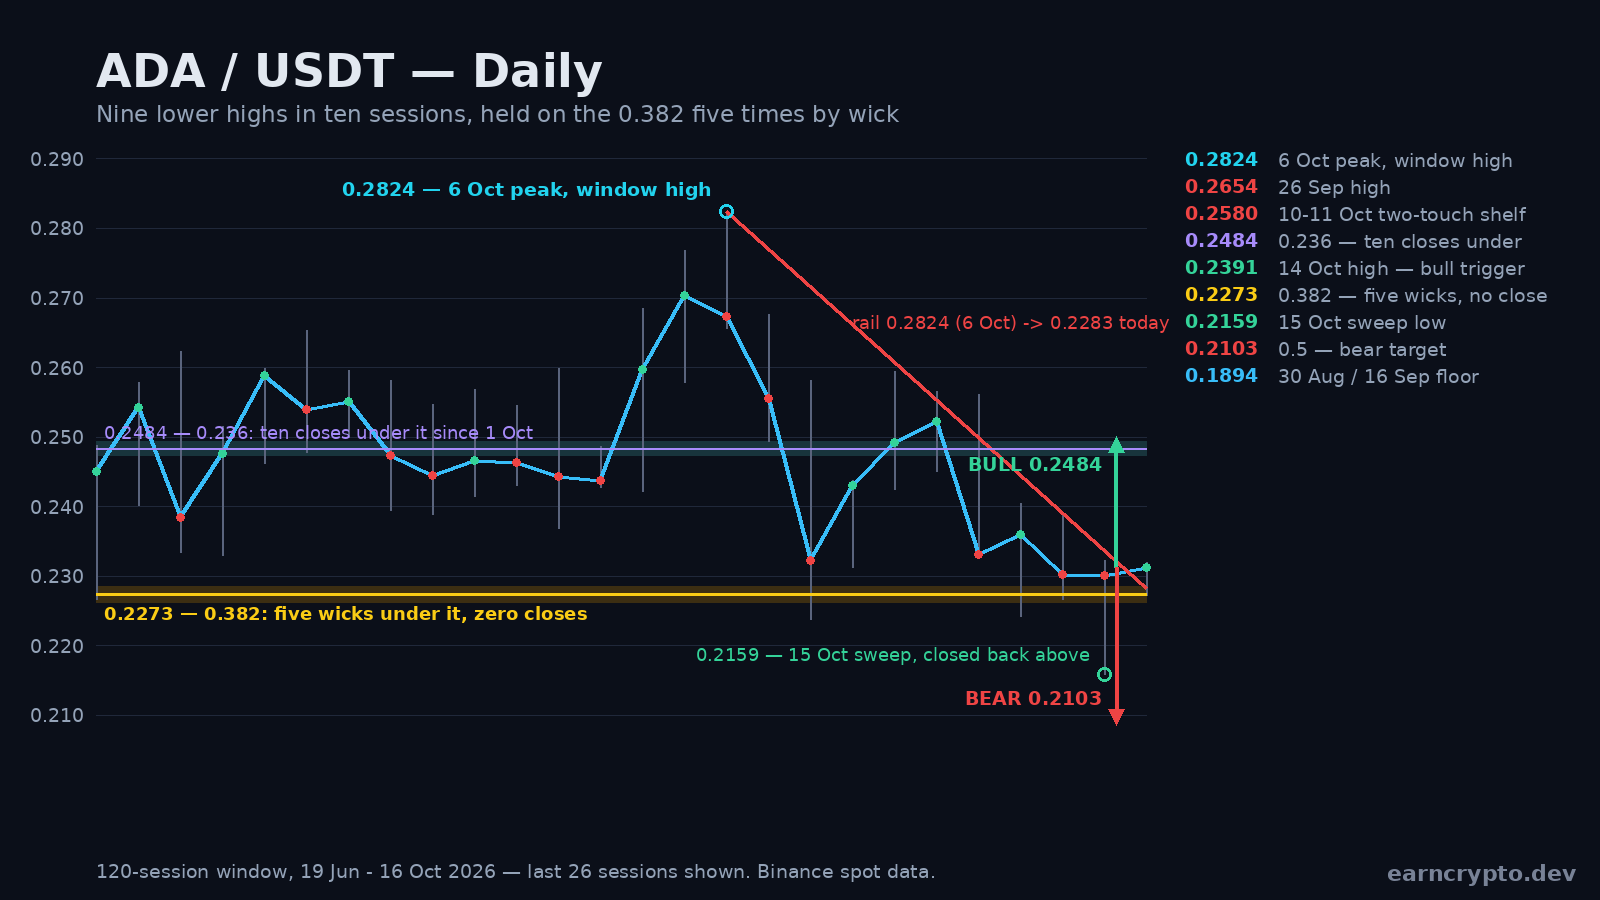
Cardano closed at 0.2315 on 16 October, 18.1% under the 0.2824 print it made on 6 October — a high that is still the highest of the entire 120-session window. In the ten sessions since, nine have printed a lower high than the one before.
The one exception was 10 October, when the high came in at 0.2595 against 0.2437 the session before. Everything else has stepped down in order: 0.2677, 0.2582, 0.2437, 0.2595, 0.2565, 0.2561, 0.2405, 0.2391, 0.2323 and today's 0.2319. That is a ladder, and ladders are only interesting when something underneath refuses to give.
Advertisement
Nine Lower Highs, One Exception
The June to October leg ran from 0.1382 on 25 June to 0.2824 on 6 October — 104.3% in fifteen weeks — and its retracement rungs now frame the market on both sides: the 0.236 at 0.2484 overhead, the 0.382 at 0.2273 and the 0.5 at 0.2103 underneath, with the 0.618 at 0.1933 and the 0.786 at 0.1691 further down.
Ten of the sixteen closes since 1 October have printed under the 0.236 at 0.2484, and the only two above it since the peak are 10 and 11 October at 0.2492 and 0.2523. In other words: the market topped at 0.2824 and has spent essentially every session since below the first Fibonacci rung of the move it just made.
Advertisement
Five Wicks Under the 0.382, Zero Closes
The 0.382 of that same leg sits at 0.2273. Four sessions have traded through it — 8 October at 0.2238, 13 October at 0.2242, 14 October at 0.2266 and 15 October at 0.2159 — and today's low of 0.2272 has nudged under it again: a fifth violation, by a single tick. Not one of the five closed under it.
The deepest of them is the most interesting. 0.2159 went 0.0114 through the line — 67% of the distance from the 0.382 down to the 0.5 at 0.2103 — and the session still closed at 0.2301, 0.0028 back above the fib. What the sweep did not have was volume: 164.82 million ADA, 0.96x the twenty-day average of 171.77 million. No capitulation signature, no record tape, no transfer of size.
Today is the mirror image of that: a 0.0047 range against a twenty-day average of 0.0171, a 0.12x volume pace, and a close 0.2315 parked 0.0042 above the 0.382. Sellers got their print on 15 October and buyers got their close; neither side has paid for anything yet.
Five wicks under a line and not one close beneath it is the market telling you where the bid is — but it is not the same thing as a break that failed on size.
The Rail and the Converging Apex
A descending rail drawn from the 6 October peak through the 14 October high — 0.2824 to 0.2391 — reads 0.2283 today, ten ticks above the 0.382 at 0.2273. Today's high of 0.2319 has poked 0.0036 above that rail. It is a guide rather than a lid: the two upper wicks of 11 and 12 October at 0.2565 and 0.2561 also pierced it.
The window's own arithmetic is unhelpful to both sides. The twenty-day mean sits at 0.24593, 5.95% above spot; the fifty-day mean at 0.22883, 1.08% below it; ATR(14) is 0.0168, or 7.25% of spot. This is a market moving 7% a day whose twenty-day mean is nearly 6% away, which is exactly why every attempt to read a single daily candle as a resolution has failed since 6 October.
Walking the Ladder From Here
Above spot, the first close worth having is the 14 October high at 0.2391, then the 9 October high at 0.2437, then the 0.236 at 0.2484. Beyond that the 10 and 11 October two-touch shelf at 0.2580 and the 26 September high at 0.2654 are the last structures before the 6 October peak.
Below, the route is 0.2159, then the 0.5 at 0.2103, then the 0.618 at 0.1933 — which lands thirty ticks from the 0.1903 print of 16 September and the 0.1894 of 30 August, the two lows that define the last floor under this market.
What the 0.2273 Line Decides
The bull case needs a close over 0.2391 to start. It would break the lower-high sequence on the first attempt, put 0.2437 in play and give the 0.236 at 0.2484 as the real test. A market that cannot close over 0.2391 is still a market with nine lower highs in ten sessions, and a 5.95% gap to the twenty-day mean is a headwind rather than a coincidence.
The bear case has the momentum but not the confirmation. It needs a daily close under 0.2273, which five wicks have failed to deliver. From there 0.2159 and the 0.5 at 0.2103 are the natural targets, with 0.1933 the full extension and the 0.1903 to 0.1894 floor as the last defence above the 0.1691 rung.
Invalidation: a close over 0.2391 cancels the lower-high sequence, and a close under 0.2273 cancels the wick-and-reclaim bid. On balance the sequence of lower highs and the distance to the twenty-day mean favour the downside, but five failures on a 0.382 with zero closes under it are not nothing. That is a 55/45 to the bears, not a conviction short — and it flips on a single daily close either side of the ladder's two ends: 0.2273 below, 0.2391 above.
Written by
EarnCrypto.dev Editorial
The EarnCrypto.dev editorial team researches and reviews AI mining platforms, pools and earning tools — publishing only what passes our own checks.
Related reading
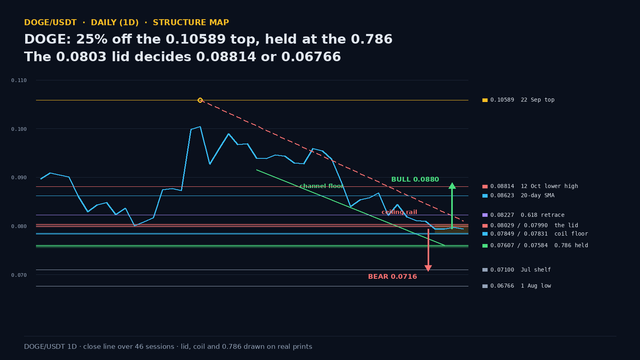
DOGE Daily Analysis — 25% Off the 0.10589 Top Held at the 0.786: The 0.0803 Lid Decides 0.08814 or 0.06766
DOGE is 25% under its 22 September top and has coiled for three sessions at 0.0800 with the 0.786 at 0.07584 intact. The 0.0803 lid decides 0.08814 or 0.06766.
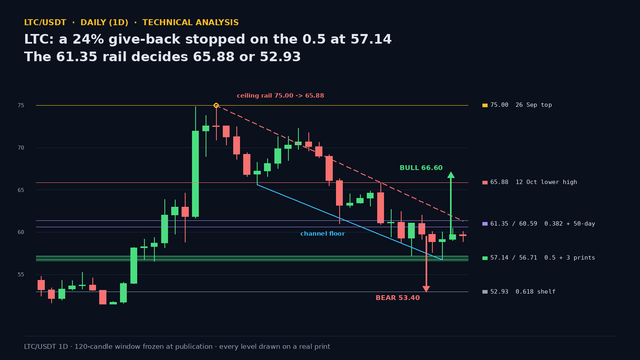
LTC Daily Analysis — A 24% Give-Back Stopped on the 0.5 at 57.14: The 61.35 Rail Decides 65.88 or 52.93
LTC's 24.4% give-back from the 75.00 top stopped on the 0.5 at 57.14 after three lower highs and three lower lows. No close has broken it. 61.35 decides.
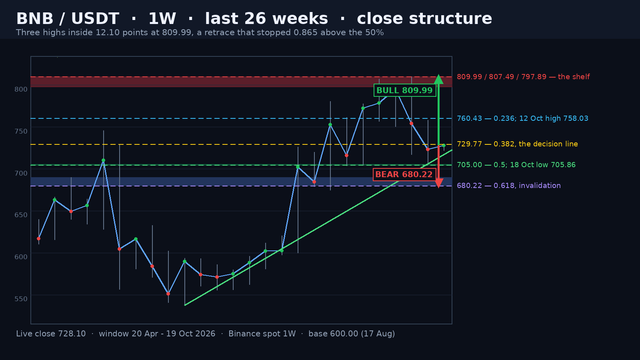
BNB Weekly Analysis — Three Highs Inside 12.10 Points at 809.99 and a Retrace That Stopped 0.865 Above the 50%: The 729.77 Line Decides 809.99 or 680.22
BNB weekly: three highs inside 12.10 points at 809.99, then a two-week retrace that stopped 0.865 above the 50%. The 729.77 line decides 809.99 or 680.22.